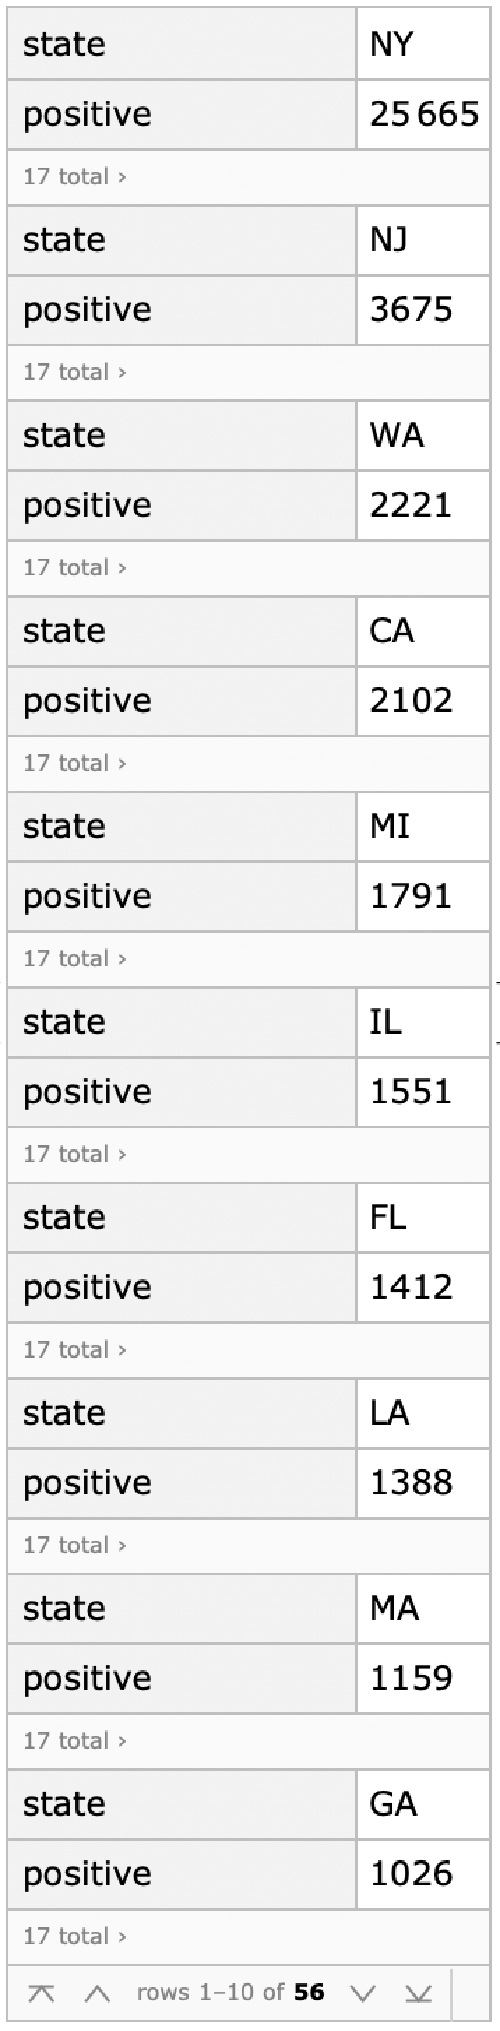
There is another useful data website for United States data, which has been put together by a group at The Atlantic. The site tracks testing that has been performed as well as the number of positive tests, which seem to follow well the cases reported by JHU CSSE. The data are available in JSON format so that a dataset can be immediately constructed with Mathematica.
https://covidtracking.com/
https://covidtracking.com/
In[]:=
tracking=Import["https://covidtracking.com/api/states","RawJSON"];trackData=Sort[tracking,#1[[2]]>#2[[2]]&]/.NullMissing[]//Dataset
Out[]=
In[]:=
Keys@Normal@trackData[[1]]
Out[]=
{state,positive,positiveScore,negativeScore,negativeRegularScore,commercialScore,grade,score,negative,pending,hospitalized,death,total,lastUpdateEt,checkTimeEt,dateModified,dateChecked}
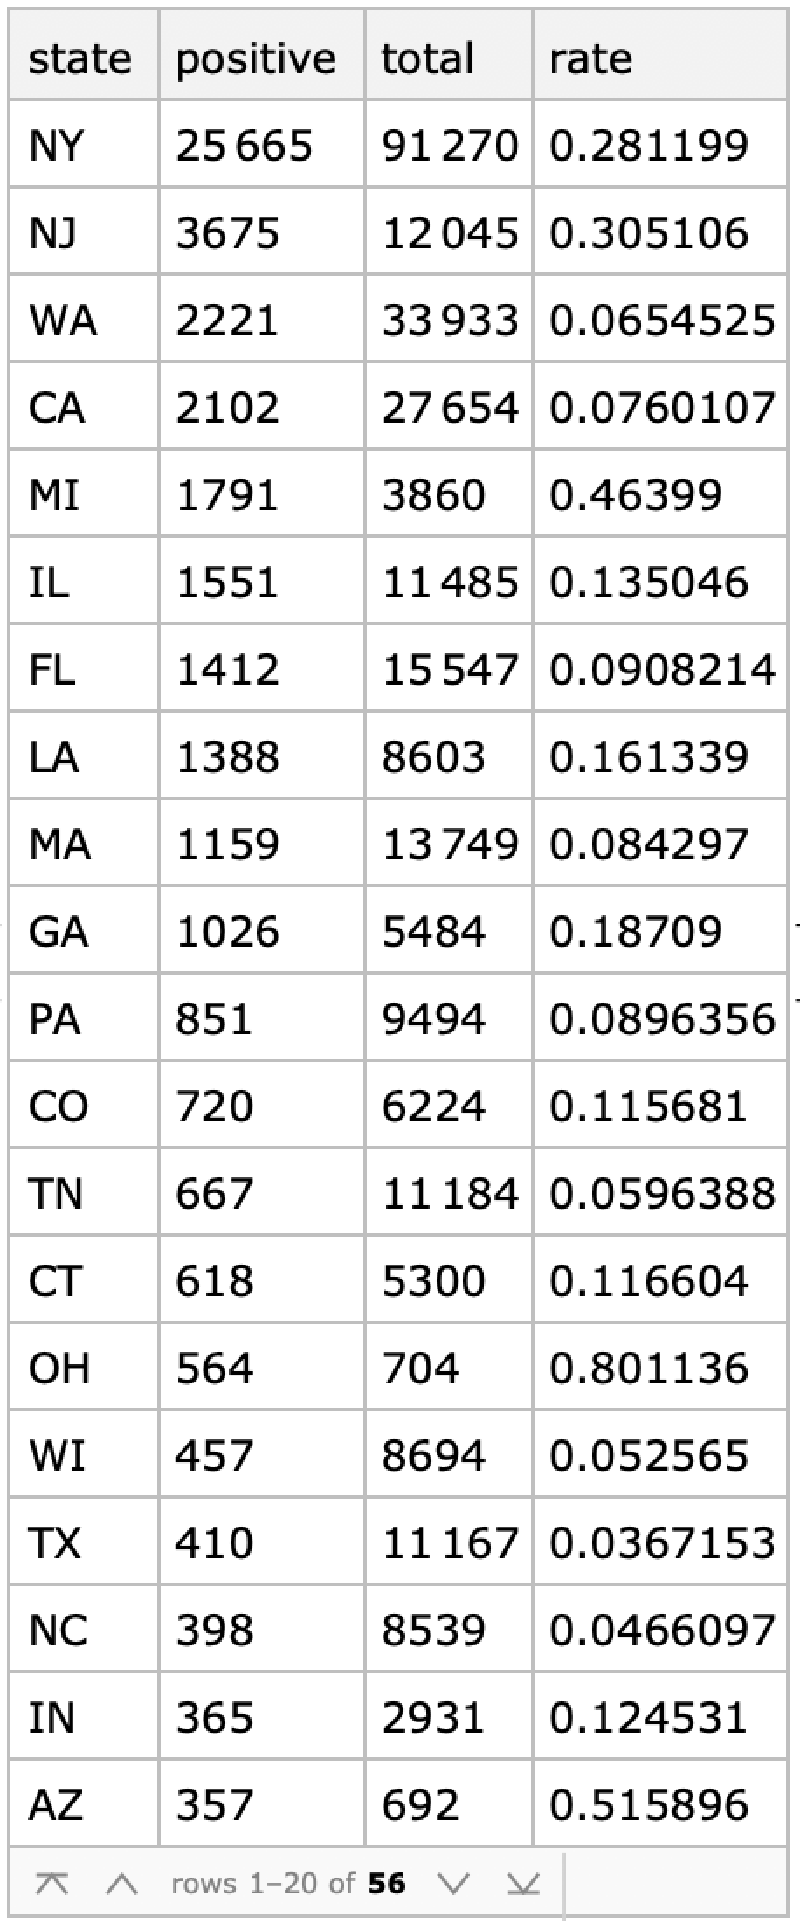
Positive test rates by state.
In[]:=
trackData[All,<|"state"#"state","positive"#"positive","total"->#"total","rate"If[#total>0,#"positive"/#"total"//N,Missing[]]|>&]
Out[]=
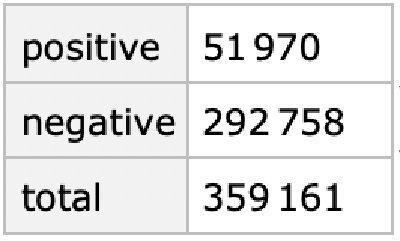
Current cumulative positive rate.
In[]:=
trackData[Total,{"positive","negative","total"}]/.Missing[]0%//Normal//Values//#[[1]]/#[[3]]&//N
Out[]=
Out[]=
0.144698
In[]:=
usDailyTracking=Import["https://covidtracking.com/api/us/daily","RawJSON"]/.NullMissing[]//Dataset
Out[]=
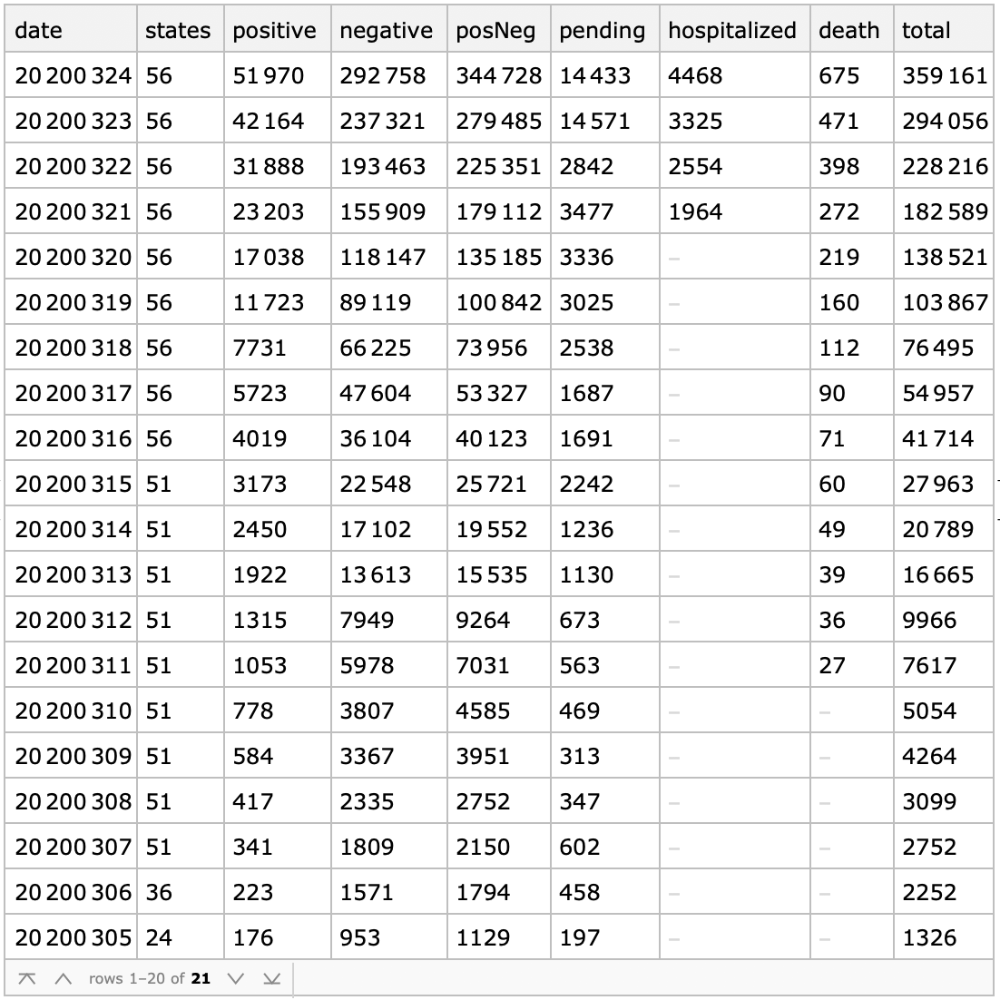
Convert to Mathematica dates.
Fits to an exponential model for positive and positive + negative.
Infection doubling time in days.
Currently the positive test rates seem stable, but there has not yet been any significant jump in testing. It will be interesting to see whether as testing increases there are higher growth rates of positive cases.
Testing is growing faster than the infection, so the positive rates will likely continue to decline.
Code
This graphic can be used to track the epidemic. The orange points are the daily differences of the logarithm of accumulated cases, i.e. an estimate of the continuous growth rate of the number of cases. The blue dots are the predicted daily rates for the course of the epidemic by a logistic growth model constrained by quarantine. The logistic model parameters are estimated from the accumulated data at the last orange point.
The current fit to the United States data is not likely very accurate, in terms of predicting the end of the epidemic, as the points above clearly are not yet defining the model but rather show widely scattered points which could be fit to any model. Nevertheless the fit is shown below with the accumulated case points, in case numbers rather than growth rates.
The next graphic shows the fit residuals. It is too soon to make any useful comment about them..
Exponential Fit at this point will also look good.