This project intends to rank US states by their "flyoverness," or the ratio between the flights that fly over a state and those that take off or land in the state. I approached this project by analyzing a diverse set of flight paths using the FlightData function . A general trend that can be observed from my results is that the highest concentration of flyover states exists in the mid-west and the south of the United States, with coastal states tending to have a much lower flyoverness ranking.
Introduction
Introduction
For my project at Wolfram’s 2022 High School Summer Camp, I ranked US states by their flyoverness—in short, the relationship between the number of flights that fly over a state and those that have the state as an origin or destination. This project immediately stood out to me; as an avid lover of aviation, the prospect of analyzing aircraft movements and broader passenger movements in the US was quite alluring. With this project, I aim to analyze passenger movement patterns and identify passenger hubs across the United States. I went about completing this project by analyzing a multitude of flight paths on a diverse set of domestic routes: first, I wrote a function that would take a given flight and output the list of states flown over by the flight (including start/destination.) Next, I created two lists, one for the origin/destination of every flight tested, and one for the states flown over by every flight tested. I then created a function that would take a route as its argument, select two flights from the route, and add its origin/destination and the states it had flown over to the designated lists. Finally, I tallied the lists, to see how many times each state had been flown over or used as an origin/destination.
Creating a Flight Route Analyzer
Creating a Flight Route Analyzer
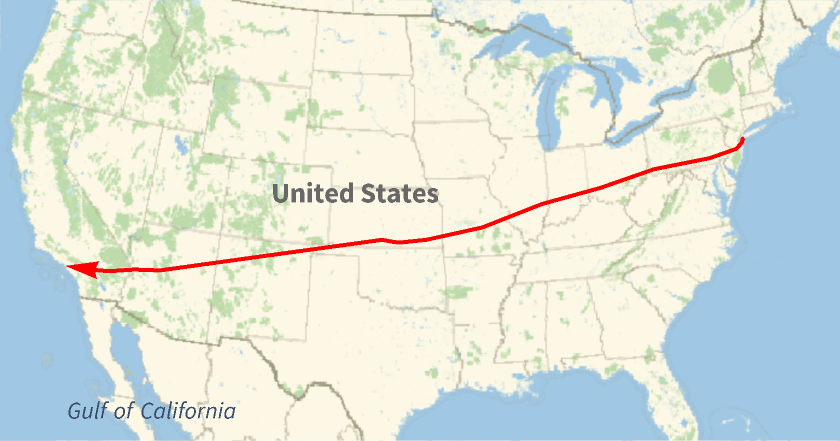
In order to analyze states' flyoverness, I had to examine different paths taken by domestic flights. A map, along with a multitude of data on a flight, can be accessed using the FlightData Function:
For the purposes of this demonstration, I'll be using Jetblue Flight 123 (from John F Kennedy International Airport in New York to the Los Angeles International Airport) on July 13, 2022.
In[]:=
FlightData,"FlightMap"
Out[]=
In[]:=
FlightData,"FlightPath"
Out[]=
GeoPosition

First, I created the StateList function, which converts a given flight to the list of states that the flight flies over.
In[]:=
StateList[x_]:= Module[{Data = FlightData[x, "FlightPath"], positionlist, coordinatelist, statelist, newstatelist}, positionlist = Thread[Data]; coordinatelist = Delete[#[[1]], {{3},{4}}]&/@ positionlist; statelist = GeoIdentify["USState", GeoPosition/@coordinatelist]; newstatelist = DeleteDuplicates[statelist]; newstatelist = Flatten[newstatelist]]
First, the function uses the FlightData to obtain flight path information. It uses Thread[%] to convert the information from a graphical representation to a list containing latitude, longitude, altitude, and time. Only latitude and longitude are needed, so the other elements of the list are removed. Next, each coordinate pair is matched with its respective (when applicable) state, and duplicates are deleted. As a final product, the function outputs the list of states an aircraft flies over, given any domestic flight within the US.
A demonstration of the StateList function, run for JetBlue Flight 123 on July 13, 2022.
In[]:=
StateList
Out[]=
,,,,,,,,,,,,
Tallying States
Tallying States
With state information now available, a tallying method needed to be used. For this, I created two new lists, one for all instances of states being flown over, and one for all instances of states being used as a source or destination. These lists held the data for every flight tested and were tallied at the end, storing the number of times each state was flown over and how many times they were used as an origin/destination for a flight.
flyoverlist = {};origindest = {};
The StateList function outputs the list of states that an aircraft flies over throughout a flight. This can be sorted into two separate lists, one for flyover states and another for origin/destination states using the ListAdd function, defined below.
In[]:=
ListAdd[x_]:=Module[{Data = FlightData[x, "FlightPath"],statelistoutput, newstatelistoutput}, statelistoutput = StateList[x]; origindest = Append[origindest, statelistoutput[[1]]]; origindest = Append[origindest, statelistoutput[[-1]]]; newstatelistoutput = Delete[statelistoutput, 1]; newstatelistoutput = Delete[newstatelistoutput, -1]; flyoverlist = Join[flyoverlist, newstatelistoutput]]
To simplify the testing process, every route being tested had two flights selected from it and run.
In[]:=
flightTolist[x_]:=Module[{Data = FlightData[x, "Flights"], FlightList},FlightList = x;Table[ListAdd[FlightList[[i]]], {i,2}]]
Testing Flight Paths
Testing Flight Paths
To acquire data about what states are the most flown over, I tested a multitude of flight paths from the same day (July 13, 2022). While testing, I tried to incorporate routes with an origin/destination in as many states as possible, so that the resulting data could be as diverse and accurate as possible.
First, I created a list of all the flight paths I wanted to test:
In[]:=
paths=
Next, I applied the flightTolist function to the list of flight paths, running all of them.
In[]:=
flightTolist /@ paths
With all flight data evaluated, I tallied each list, so that I could see how many times each state was flown over and how many times it was used as an origin or destination.
In the tallied list below, each state is followed by the number of times it was used as an origin or destination.
In[]:=
Tally[origindest]
Out[]=
,20,,21,,14,,5,,14,,8,,8,,18,,10,,8,,2,,4,,2,,4,,6,,2,,2,,2,,2,,4,,2,,1,,4,,2,,6,,2,,4,,2,,1
The number of times each state was flown over in the data that was run.
In[]:=
Tally[flyoverlist]
Out[]=
,16,,17,,10,,13,,16,,14,,16,,17,,20,,18,,21,,10,,9,,13,,8,,9,,6,,6,,6,,7,,4,,3,,9,,9,,4,,12,,6,,15,,8,,11,,7,,3,,1,,6,,1,,7,,12,,11,,10,,7,,6,,4,,3,,4,,2,,3
Analysis of Results
Analysis of Results
Please note that the routes tested did not include all states due to time constraints. As a result, certain states will have a 100% flyoverness rating. For this project, Hawaii and Alaska were not tested.
Below is the GeoRegionValuePlot for the US, taking in a list of correspondences between states and their flyoverness percentages. This is used to generate a heat map of the US, in terms of flyoverness.
In[]:=
GeoRegionValuePlot->31, ->0, ->100, ->0, ->30, ->38, ->44,->74, ->72, ->33 , ->20, ->82,-> 43, ->40, ->96, ->73, ->54,->80,->81, ->100, ->87, ->100, ->90, ->100,->91, ->100, ->71, ->100, ->86, ->75, -> 100, ->100, ->100, ->100, ->100, ->100, ->86, ->100, ->33, ->73,->100, ->83, ->100, ->86, ->100, ->100,->100, -> 0
The Midwest and Southern United States, in particular, have the most flyover states. States like Kansas, Nebraska, Kentucky, Ohio, Indiana, Iowa, and Arkansas all had very high flyover percentages from the data collected. Though these would be lower in real life (few airports tested for these states), they are indicative of general passenger movements; the majority of passenger traffic flies from coast to coast, or along the coast, and the middle of the country is often flown over. Some non-coastal states like Illinois and Georgia are home to bustling cities which attract passenger traffic. As a result, these states' flyover percentages are drastically reduced. Naturally, states with the highest populations like New York, California, Texas, and Florida have lower flyover percentages.
Using an association to contain a bar graph relating states and their flyoverness.
The bar chart below shows the association between each state and its flyoverness percentage.
As visible above, the states with the lowest flyoverness are California, Florida, Georgia, Massachusetts, New York, Rhode Island, and Texas. Since some states don't have origin/destination tallies (due to time constraints), their flyoverness percentage is 100%. In reality, since most of these states have no major airports, their flyoverness would only be slightly lower. As a result, the list of states with the highest flyoverness isn't as specific as the list of states with the lowest flyoverness.
Conclusion and Future Work
Conclusion and Future Work
Analyzing flyover data for states is an important tool for observing passenger movements, allowing us to see where people choose to go. With a broader look at flyover data, a few general trends can be observed: for one, the states with the highest flyover rates are located in the middle of the country—comparatively, very few flights land in these states. Instead, flights seem to be the most prevalent from coast to coast, or along coasts. Certain non-coastal states that are home to major population centers also receive lots of passenger traffic, drastically reducing their flyover rates.
The bounds of this project could be expanded to offer a broader view of passenger traffic flows. Through doing so, a comparison can be drawn between passenger movements in the US and in other countries. Perhaps this can even be expanded to entire continents.
The bounds of this project could be expanded to offer a broader view of passenger traffic flows. Through doing so, a comparison can be drawn between passenger movements in the US and in other countries. Perhaps this can even be expanded to entire continents.
Acknowledgements
Acknowledgements
I’d like to thank my mentor Adiba Shaikh and my group’s TA Nika Chuzhoy for guiding me and assisting me with my project. I’d also like to thank my fellow group members, Sophie, Anthony, and Margaux, for creating a supportive and encouraging work environment. Finally, I thank camp directors Rory Foulger and Megan Davis for running this summer program and Stephen Wolfram for coming up with this project idea.