Over the past decade, data science has become an essential lens for understanding the world. From business to biology to education, interpreting time series trends and statistical patterns is now a core skill. And yet, students often encounter these tools only through isolated formulas and static graphs rarely in a way that lets them ask real questions and explore answers for themselves.
This project aims to change that.
Using Wolfram Language, I created an interactive learning notebook that guides high school students through an exploration of U.S. dropout rate data (1975–2013), available through the Wolfram Data Repository. The activity blends time series modeling, descriptive statistics, and student-authored queries. Along the way, students pose meaningful questions like “Are dropout rates going down?” or “How do trends differ by group?”, and use computational tools to investigate.
At the core is a custom-built LLM persona that responds to natural language prompts: generating summaries, graphs, and statistical comparisons on demand. By integrating classical analysis with modern AI tooling, students don’t just practice statistics—they begin to think like analysts.
“Computational thinking is going to be a defining feature of the future. If you don’t have it, you’re going to be left behind.”
— Stephen Wolfram
— Stephen Wolfram
Introduction
Introduction
How can high school students learn real data science without waiting until college? This project addresses that question by designing a classroom-ready learning experience that places authentic data and computational tools directly into students’ hands. Using a publicly available dataset from the Wolfram Data Repository, which includes U.S. high school dropout rates from 1975 to 2013 disaggregated by race and gender, students engage in structured inquiry to explore how educational outcomes have evolved over time. Through this experience, students learn to formulate meaningful statistical questions, conduct descriptive and comparative analyses, and interpret time series trends using the Wolfram Language.
One of the features of the notebook is a Variable Type Data Analysis Taxonomy, which helps students identify which statistical techniques are appropriate for different types of data. For example, they learn to compute averages and standard deviations for continuous variables, conduct group comparisons, and model long-term patterns for time series variables such as dropout rates. Students are introduced to techniques such as linear modeling, change detection, and slope analysis, and they develop visualizations that include error bands, trend overlays, and group gap plots. These techniques are not presented as isolated calculations but as components of a coherent investigation driven by student questions. To support open-ended exploration, the notebook also integrates a custom LLM-based tool, and a persona, statHelper, which interprets natural-language queries and routes them to appropriate analytical functions. For instance, when students ask “What is the dropout trend for Black males?” or “Compare dropout rates between Hispanic and Black female students,” the tool generates appropriate time series plots, statistical summaries, and contextual interpretations.
By combining classical statistics, modern automation, and scaffolded pedagogical design, this project equips high school learners with both conceptual and computational fluency. It is well aligned with the goals of AP Statistics, introductory data science, and emerging AI education curricula, and offers students a meaningful opportunity to engage with real-world data through accessible, inquiry-driven exploration.
Learning Objectives:
Learning Objectives:
◼
Identify variable types and group relationships
◼
Summarize data using descriptive statistics
◼
Analyze trends with linear models and contextual reasoning
◼
Visualize patterns
◼
Forecast dropout rates using time series models
◼
Compare trends across and within demographic groups
Before diving into the analysis, it’s important to understand what kind of data we’re working with, and what types of analysis make sense for that data. The Variable Type Data Analysis Taxonomy below helps map different analysis techniques to common variable types such as discrete and continuous numeric values, Booleans, ordinal scales, timestamps, and time series.
Out[]=
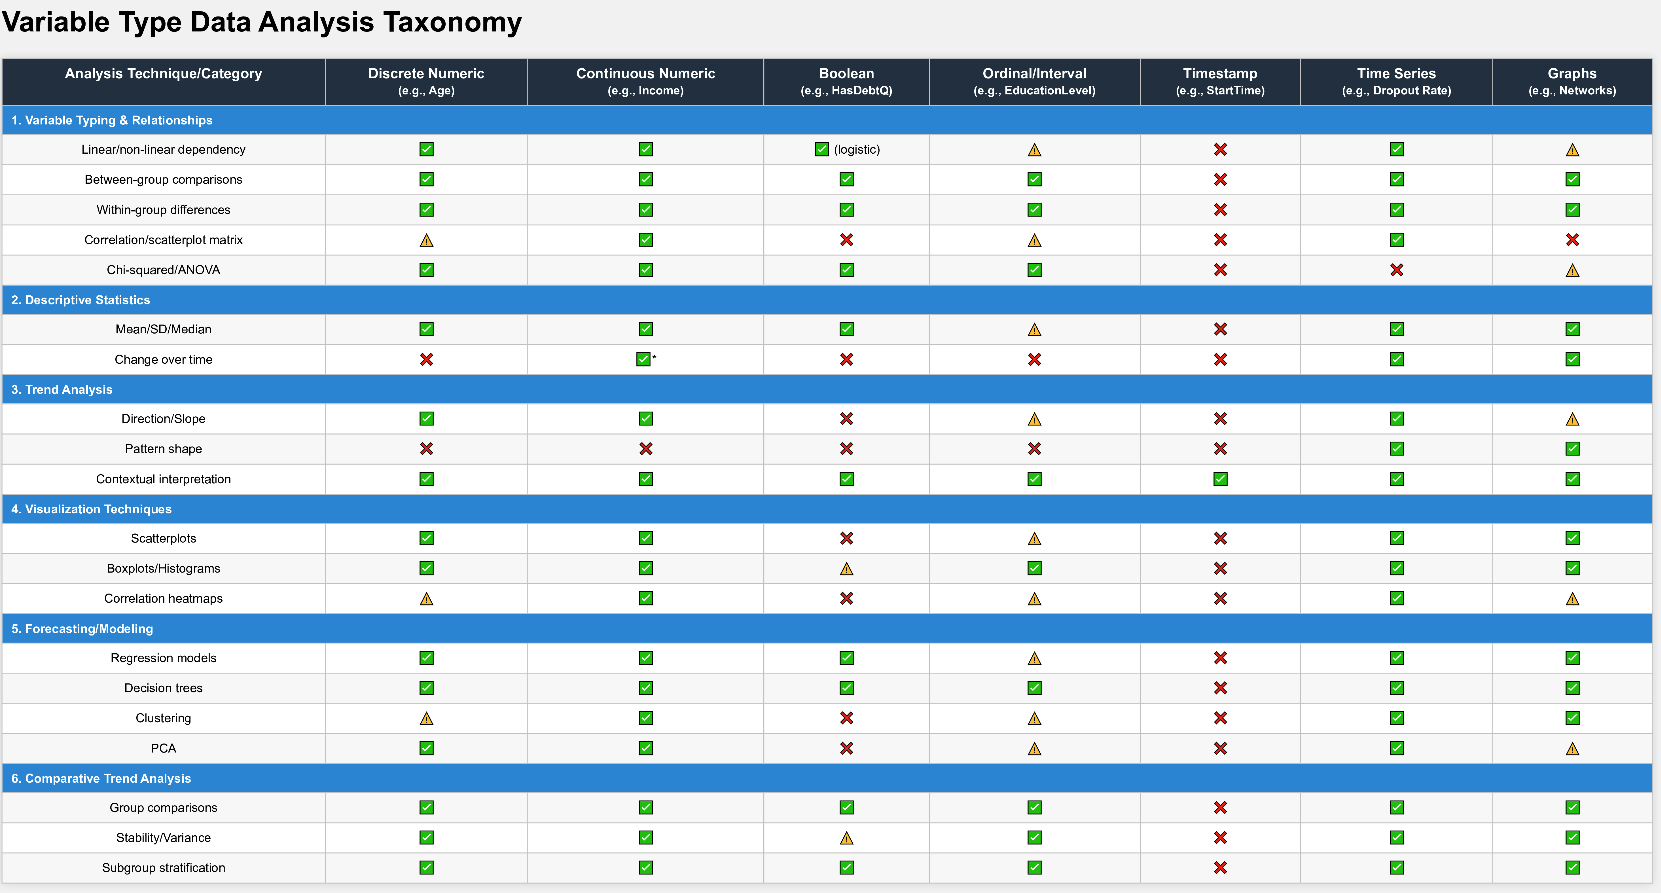
Today, we’ll be working primarily with time series data, since dropout rates are measured annually over multiple decades. Time series variables allow us to analyze changes over time, identify trends or patterns, and even forecast future outcomes. According to the taxonomy, time series data are especially well suited for trend analysis (like computing slope or direction), contextual interpretation, visualizations like line plots and error bands, and forecasting techniques such as regression modeling.
Have you ever wondered why some students don’t finish high school? Or who is most likely to leave—and whether that’s been changing over time? Behind every dropout statistic is a student. And behind every group trend is a larger story about opportunity, equity, and change in our education system. We will explore the U.S. high school dropout rates from 1975 to 2013, broken down by race and sex. You’ll ask and answer questions like:
◼
Are dropout rates going down overall?
◼
Have the gaps between groups (by race or gender) gotten smaller?
◼
Which groups have improved the most?
◼
What events might explain sudden changes in the data?
◼
Can we use past data to forecast future dropout rates?
Through data analysis and statistics, you’ll gain the tools to answer these questions and uncover meaningful insights from the data.
Data from the Wolfram Data Repository
Data from the Wolfram Data Repository
We can start exploring these questions using real data from the Wolfram Data Repository:
Out[]=
ResourceObject


Let’s load the data and inspect what it contains:
In[]:=
resource=ResourceObject["US High School Dropouts by Sex and Race"];data=ResourceData[resource];
The dataset didn’t display as our code has ‘;’ at the end of the line. Let’s take a look at the first five rows in the dataset:
Out[]=
We can also see which demographic subgroups are available for analysis if you type:
Out[]=
Let’s take a look at one of the time series:
For example, here is the dropout rate for Black students:
Out[]=
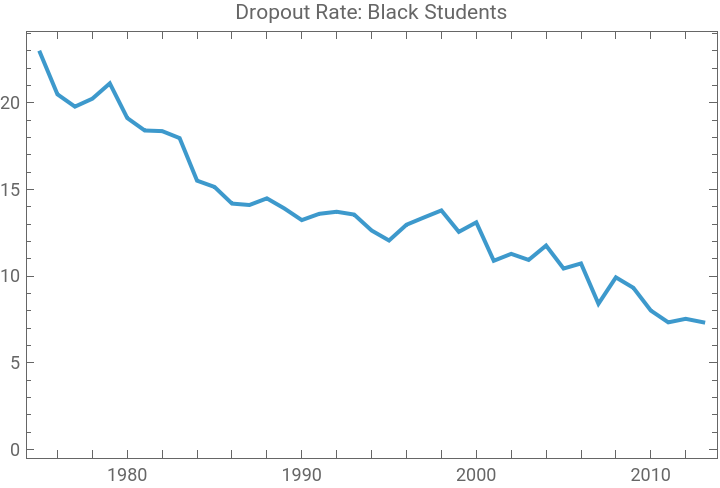
This gives us a clear view of how that rate has changed year by year. We can see that the dropout rate in 1977 was over 20% and had dropped to about 7% by 2013.
Your turn
Your turn
◼
Analyze the trend for Hispanic students. Is it similar or different?
See answer
See answer
Out[]=
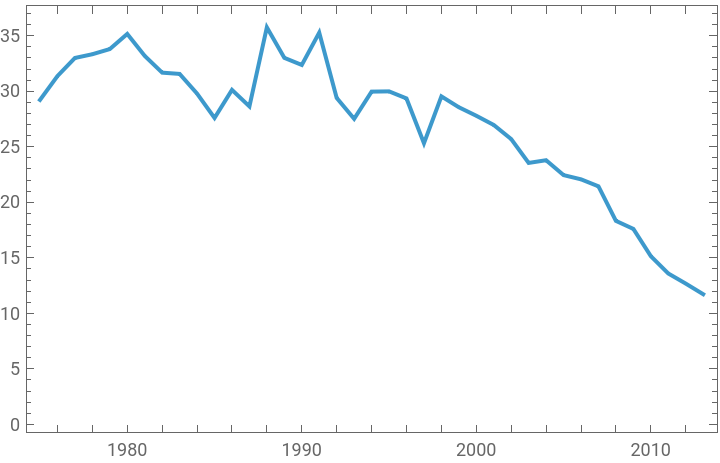
The dropout rate for Hispanic students follows a similar overall trend to that of Black students, with a steady decline from a high starting point in the late 1970s to a much lower rate by 2013. In 1977, the rate was around 35%—notably higher than that of Black students—and while both groups saw improvement over time, the Hispanic trend includes more fluctuations, particularly in the late 1980s and early 1990s. After 2000, the rate dropped more consistently, reaching about 13% by 2013. The earlier volatility may reflect shifts in immigration patterns, educational access, or data reporting practices.
Variable Typing & Relationships
Variable Typing & Relationships
Before we dive into analysis, let’s figure out what kinds of variables we’re working with. Understanding the type of each variable: numeric or categorical helps us decide which statistical methods and plots are appropriate.
Variable Types
Variable Types
Question: Are dropout rates numeric or categorical? What about group identifiers like race or gender?
Question: Are dropout rates numeric or categorical? What about group identifiers like race or gender?
What is the data type?
In[]:=
Head[data["DropoutRateBlackMale"]]
Out[]=
TemporalData
Now let’s look inside one:
This shows pairs of {date, value}, where the values are dropout percentages for each year.
Interpreting Variable Types
Interpreting Variable Types
◼
Dropout rates are numeric values (e.g., 22.3%) that vary over time.
◼
Group labels such as “Black,” “White,” “Male,” and “Female” are categorical, they define subgroups.
So we’re working with numeric time series data grouped by categorical variables.
Relationship Types
Relationship Types
Now that we’ve identified our variables, we can ask: How do these numeric values change over time, and how do they compare between groups?
We’ll explore:
◼
Whether the trend is linear or nonlinear
◼
Whether gaps between groups are shrinking or stable
◼
Whether there are differences between sexes within a group
Between-Group Comparison
Between-Group Comparison
Stacked Dropout Rates: Black vs. White Students:
These plots help us compare dropout rates across multiple demographic groups, including Black, White, Hispanic, and All Students. In both visualizations, we can observe differences in starting levels and trends over time. For example, the gap between Black and White students is clearly visible in the earlier years, but how does that gap evolve? Does it narrow, stay stable, or fluctuate? Similarly, how do Hispanic student dropout rates compare to the others? To answer these questions, let’s quantify the differences between groups year by year and explore how the trends shift over time.
These plots help us compare dropout rates across multiple demographic groups, including Black, White, Hispanic, and All Students. In both visualizations, we can observe differences in starting levels and trends over time. For example, the gap between Black and White students is clearly visible in the earlier years, but how does that gap evolve? Does it narrow, stay stable, or fluctuate? Similarly, how do Hispanic student dropout rates compare to the others? To answer these questions, let’s quantify the differences between groups year by year and explore how the trends shift over time.
Differences between groups year by year:
In the late 1970s, the gap was over 10 percentage points, meaning Black students were much more likely to drop out than White students. Over the next few decades, the gap gradually decreased, although not in a perfectly smooth line. There were some fluctuations, particularly in the 1990s and early 2000s, but the overall trend is downward. By 2013, the difference had narrowed to about 2–3 percentage points, suggesting that although disparities still exist, they have shrunk significantly over time.
Within-Group Comparison (Sex Differences)
Within-Group Comparison (Sex Differences)
Dropout Rates: Black Males vs. Females:
Gender Gap: Black Male - Black Female:
From 1975 to the early 2000s, the gap between Black male and female dropout rates was usually above zero. This means that Black males dropped out more often than Black females during those years. But the size of the gap changed a lot over time: sometimes it got very small, and in a few years, it even flipped. These ups and downs may reflect changes in things like school policies, job opportunities, or challenges in communities. By 2013, the gap was still there but smaller than before, showing that some progress has been made, even though differences between male and female dropout rates still exist.
Your turn: Analyse the trends for Hispanic students
Your turn: Analyse the trends for Hispanic students
Descriptive Statistics
Descriptive Statistics
Descriptive statistics help us summarize and interpret time series data so we can answer important questions like:
◼
What’s the average dropout rate for a group over time?
◼
When were the highest and lowest rates, and how much have things changed?
◼
Is the data stable or highly variable?
Let’s apply these tools to dropout data for Black students as an example.
Let’s apply these tools to dropout data for Black students as an example.
Compute Key Statistics
Compute Key Statistics
This tells us that the average dropout rate for Black students across the years is about 13.7%, with a standard deviation of about 4.1%, indicating a moderate amount of variability over the years.
Standard Deviation and Standard Error
Standard Deviation and Standard Error
We’ve calculated the standard deviation of dropout rates for Black students over time and also used the dataset’s average standard error for Black male dropout rates.
Although standard deviation and standard error measure different things, they are closely related:
Although standard deviation and standard error measure different things, they are closely related:
◼
Standard Deviation (SD) measures how spread out the dropout rates are across the years.
◼
Standard Error (SE) tells us how precisely each year’s dropout rate estimates the true population rate.
Using our computed standard deviation (~4.06%) and this average SE, we can estimate the implied sample size:
This means that, if the dropout rates had a standard deviation of 4.06% and a standard error of 1.24%, that would suggest a sample size of about 11 students per year.
But be careful! This is not the actual sample size, it’s just a way to show how the numbers relate. In reality, the data likely comes from many more students, and we would need access to the original survey methodology to know for sure.
But be careful! This is not the actual sample size, it’s just a way to show how the numbers relate. In reality, the data likely comes from many more students, and we would need access to the original survey methodology to know for sure.
Find Minimum and Maximum with Years
Find Minimum and Maximum with Years
Calculate Overall Change (1975 → 2013)
Calculate Overall Change (1975 → 2013)
To understand the long-term trend in dropout rates for Black students, we identified the highest and lowest values in the dataset. The highest dropout rate was 22.90% in 1975, and the lowest was 7.34% in 2011.
To understand how dropout rates for Black students changed over time, we calculated both the absolute decrease and the percent (relative) decrease between the highest and lowest recorded values.
The dropout rate for Black students declined from 22.90% in 1975 to 7.34% in 2011, representing an absolute decrease of 15.56 percentage points and a relative (percent) decrease of approximately 67.9%. This substantial decline highlights significant long-term progress in improving school retention and completion among Black students. While some variability remains over the years (as indicated by a standard deviation of 4.06%) the overall trend points to a meaningful reduction in dropout rates over the examined period.
Focus on a Specific Time Window
Focus on a Specific Time Window
Want to zoom in on a decade?
Focusing on the decade between 1985 and 1995 reveals short-term fluctuations within a broader downward trend in the dropout rate for Black students. The rate begins at approximately 15.2% in 1985 and gradually declines to about 12.0% by 1995. After an initial dip followed by a slight rebound, the rate steadily decreases through 1990. A modest rise occurs in the early 1990s, peaking around 1992, before dropping sharply by the mid-1990s. This window captures both the variability of year-to-year changes and the overall momentum of progress, likely shaped by policy interventions and systemic shifts during that period. Despite fluctuations, the decade concludes with an absolute decrease of about three percentage points, reinforcing the long-term trend of improvement. To better visualize this trend, a 5-year moving average was applied to the dropout rates:
Moving Average: Smoothing the Trend
Moving Average: Smoothing the Trend
To reduce short-term noise and reveal the long-term trend, apply a moving average:
This smoothed series removes short-term noise and reveals a steady decline from roughly 20.9% to 7.9%. The moving average underscores the sustained nature of the progress, providing a clearer picture of the structural decline in dropout rates over time. Together, these perspectives highlight both the immediate dynamics and the enduring trajectory of educational gains.
Visualizing uncertainty
Visualizing uncertainty
How has the dropout rate for Black male students changed over time, and what is the uncertainty in the measurement?
Trend analysis
Trend analysis
How have dropout rates for Black and Hispanic students (males vs. females) changed from 1975 to 2013?
Specifically, what is the overall direction and slope of these trends? Are there cyclical patterns, and how might historical events (like policy changes, economic shifts, or immigration enforcement) explain peaks and dips?
Specifically, what is the overall direction and slope of these trends? Are there cyclical patterns, and how might historical events (like policy changes, economic shifts, or immigration enforcement) explain peaks and dips?
Compute the overall direction and Percent change
Compute the overall direction and Percent change
Compute the dropout rates among Black male students:
From 1975 to 2013, dropout rates among Black male students declined significantly—from about 22.96% to 8.18%, an overall drop of nearly 15 percentage points. This reflects an average annual decrease of approximately 0.35%. The decline was not uniform. After a brief spike around 1980–1981, rates steadily decreased through the mid-1980s. From 1985 to 1991, progress slowed with a plateau around 13–15%. The sharpest drop occurred between 1991 and 1995, when rates fell rapidly to under 10%, likely influenced by early 1990s education reforms. From the mid-1990s onward, the decline leveled off, with rates stabilizing just above 8% by 2013.
Other groups:
Other groups:
Compute the dropout rates among Black female students:
From 1975 to 2013, dropout rates among Black female students steadily declined, falling from approximately 22.86% to 6.55%. This represents an overall decrease of more than 16 percentage points, with an average annual decline of about 0.33%. While the downward trend was consistent, the pace varied across decades. In the late 1970s and early 1980s, rates fluctuated slightly, hovering between 20% and 17%. However, the overall trajectory remained downward. By the early 1990s, dropout rates had reached around 13%, and by the mid-1990s, they had dropped below the 10% threshold for the first time. From the mid-1990s through the early 2000s, the decline continued more gradually, with rates stabilizing in the 9–11% range. A final phase of more pronounced improvement occurred between 2003 and 2013, culminating in the lowest observed rate of 6.55%.
Compute the dropout rate among Hispanic male students:
Dropout rates among Hispanic male students exhibited the most dramatic fluctuations and overall improvement between 1975 and 2013. Starting at around 26.66% in 1975, the rate surged to over 39% by the late 1980s, representing the highest peak in the entire dataset. This steep increase may reflect the growing number of immigrant youth entering the U.S. school system during that period, many of whom faced systemic barriers such as limited English proficiency and lack of institutional support. After peaking, the trend reversed in the early 1990s. Dropout rates fell steadily, dropping to under 25% by the late 1990s and continuing a consistent downward trajectory throughout the 2000s. By 2013, the rate had declined to just 12.62%, reflecting an overall drop of roughly 14 percentage points. This translates to an average annual decrease of approximately 0.40%.
Compute the dropout rate among Hispanic female students:
Conclusions
Conclusions
Dropout rates among Hispanic female students began at approximately 31.57% in 1975 and declined steadily to 10.77% by 2013, marking the steepest improvement among all subgroups analyzed. This change represents an absolute drop of nearly 21 percentage points—nearly twice the reduction observed in Black female students—and an average annual decline of about 0.57%, the highest slope in our linear regression estimates. Though the overall direction is clearly downward, the early years show notable fluctuations. In the late 1970s and early 1980s, dropout rates fluctuated around 33–35%, with a peak of 35.44% in the mid-1980s. These years correspond to a period of rapid demographic change and limited institutional support for non-English-speaking students, likely contributing to instability in educational attainment. After this peak, the trend shifted toward a more consistent decline.
Beginning in the 1990s and continuing through the 2000s, the dropout rate among Hispanic female students fell sharply, dipping below 20% by the early 2000s and continuing to decrease in a nearly linear fashion. This sustained decline may reflect the growing impact of bilingual education, targeted dropout prevention programs, and federal policies emphasizing accountability and support for English language learners. By 2013, the dropout rate for Hispanic females had fallen to one-third of its initial level, suggesting substantial progress in educational inclusion and persistence.
Historical Events Related to Dropout Rates
Historical Events Related to Dropout Rates
To better understand potential external influences on shifts in dropout rates, we identified key years that correspond to notable changes in the data. These include periods of sharp increases or decreases in dropout rates, as well as phases of stabilization. Specifically, we focused on:
◼
1980–1981, which showed a temporary spike in dropout rates among Black male students,
◼
1991–1995, which marked the most dramatic period of decline across multiple subgroups, and
◼
2001–2013, when dropout rates began to level off.
To explore how broader social, economic, and educational forces might explain these patterns, we queried Wolfram Alpha for major U.S. historical events around these years using the following code:
To explore how broader social, economic, and educational forces might explain these patterns, we queried Wolfram Alpha for major U.S. historical events around these years using the following code:
Queries code:
Queries code:
WebSearch code:
WebSearch code:
WebSearch output
WebSearch output
To explore possible explanations for inflection points in dropout rates among Black and Hispanic male and female students, we queried U.S. federal education policies aligned with key years where trends shifted (1980, 1981, 1991, 1992, 1995, 2001, and 2013). While this approach surfaced relevant documents such as:
◼
The establishment of the U.S. Department of Education (1980),
◼
The No Child Left Behind Act (2001–2002),
◼
Federal special education legislation and bilingual education reforms,
◼
And discussions on federal-state power dynamics in education policy.
The overall search results were inconclusive in clearly identifying direct causal links between these federal interventions and the specific shifts in dropout rates for the subgroups of interest. Many retrieved articles discussed broad structural changes (e.g., establishment of federal departments, role of neoliberal reforms, federal-state policy tensions), but few offered targeted evidence on how these policies disproportionately impacted dropout trends by race, gender, or ethnicity.
Let’s refine our search:
Let’s refine our search:
Output
Output
Output
Output
◼
Black Males
The dropout rate for Black males has declined steadily since 1975, suggesting a long-term improvement. This trend may reflect the cumulative impact of support programs like TRIO, which provide mentoring and academic assistance to underrepresented students, and later accountability mechanisms introduced by the No Child Left Behind Act (NCLB). While NCLB aimed to close achievement gaps through standardized accountability, our manual review suggests it may have also increased reporting in some districts, complicating interpretations of its impact. Nevertheless, the consistent downward trend supports the idea that layered federal interventions helped reduce dropout rates among this group.
◼
Black Females
Dropout rates for Black females also declined over time, mirroring the pattern seen among Black males. The overall decrease aligns with findings that suggest programs like TRIO offered benefits for first-generation and marginalized students. Although Black females were not the specific target group in the literature we reviewed, the broader inclusion of underrepresented populations in TRIO may have contributed to these gains. The sustained decline, even before and after major policies like NCLB, indicates that both earlier and continuing supports played a role.
◼
Hispanic Males
For Hispanic males, dropout rates peaked in the 1980s and began declining more noticeably after the 1990s. This inflection may reflect the combined effect of GEAR UP (1999), which targeted college readiness for low-income students, and increased funding through Title I, often directed at schools with large Hispanic populations. The evidence suggests that these programs modestly reduced dropout rates while improving postsecondary pathways. NCLB may have also influenced reporting practices, but the downward trend supports a substantive improvement over time.
◼
Hispanic Females
The dropout trajectory for Hispanic females reveals a steady decline from the late 1970s through 2013. Similar to males, this improvement likely benefited from GEAR UP and Title I interventions. Though dropout rates for females were generally lower, the observed gains may reflect increased access to support structures and academic opportunities. Our manual search also pointed to mixed evidence for policy effectiveness, but the quantitative trend suggests that the combination of programs helped foster more positive educational outcomes for Hispanic female students.
Fit Linear Models for Slope (Rate of Change)
Fit Linear Models for Slope (Rate of Change)
To evaluate how dropout rates have changed over time for key demographic groups, we fit linear regression models to time series data from 1975 to 2013 for Black and Hispanic students, disaggregated by gender. The slope of each fitted model indicates the rate of change in dropout percentage over time.
We fit linear models to dropout rates over time for four key demographic groups: Black males, Black females, Hispanic males, and Hispanic females. Each group’s linear model returned two values:
◼
Intercept (the predicted dropout rate at time zero—mainly theoretical here)
◼
Slope (the rate of change in dropout rate per unit of absolute time)
We focus on the slopes, since they tell us the direction and rate of change. These slopes represent the rate of change in dropout percentage per unit of absolute time. All slope values are negative, indicating a general decline in dropout rates from 1975 to 2013. We focus on the slopes, since they tell us the direction and rate of change whether dropout rates increased or decreased, and how quickly those changes occurred over the nearly four-decade span.
We focus on the slopes, since they tell us the direction and rate of change. These slopes represent the rate of change in dropout percentage per unit of absolute time. All slope values are negative, indicating a general decline in dropout rates from 1975 to 2013. We focus on the slopes, since they tell us the direction and rate of change whether dropout rates increased or decreased, and how quickly those changes occurred over the nearly four-decade span.
◼
Hispanic Females exhibited the steepest decline with a slope of −1.80×10⁻⁸, suggesting the fastest relative improvement among all groups. This decline may reflect the cumulative impact of targeted federal programs such as GEAR UP and TRIO, which emphasized college access and readiness for low-income and underrepresented populations. While not explicitly targeted by No Child Left Behind (NCLB), Hispanic females likely benefited from the broader push for accountability and support services in high-need districts.
◼
Hispanic Males followed closely with a slope of −1.28×10⁻⁸. This group historically experienced high dropout rates, particularly in the 1980s and 1990s. The sharp decline aligns temporally with the introduction of GEAR UP (1999) and increased investment in Title I schools under NCLB, which may have helped reduce structural barriers and support re-engagement with school.
◼
Black Males showed a slightly more moderate slope of −1.11×10⁻⁸. This trend is notable given the group’s historical vulnerability to school discipline policies and structural inequities. TRIO’s mentoring and academic support programs, which explicitly targeted first-generation and underrepresented students, may have contributed to gradual improvements. However, the mixed evidence around NCLB’s impact suggests that gains could have been tempered by unintended consequences such as increased dropout reporting due to punitive accountability measures.
◼
Black Females had the shallowest decline with a slope of −1.05×10⁻⁸. While dropout rates have decreased over time, the slower pace may indicate that broader policy frameworks insufficiently addressed gendered aspects of educational disengagement. Nonetheless, steady improvement over multiple decades suggests that long-term investments in access and support have yielded incremental progress.
Visualizing Dropout Trends Across Demographics
Visualizing Dropout Trends Across Demographics
To make sense of complex data, we often need to see it. Visualizations like bar charts and line plots, heat maps, and others help highlight differences between groups and reveal patterns over time—things that would be hard to notice just by reading numbers.
Visualizing Dropout Trends by Group: Comparing Rates Over Time and by Year using BarChart and LineGraph
Visualizing Dropout Trends by Group: Comparing Rates Over Time and by Year using BarChart and LineGraph
Visualizing Dropout Trends by Group: Heat map of Change Over Time
This heat map uses color to show how dropout rates changed over time for each group. Darker shades mean higher dropout rates, and lighter shades show lower rates. You can quickly spot patterns: for example, Hispanic students had the highest dropout rates for much of the period, but all groups showed a clear decrease over time. The heat map makes it easy to see both the differences between groups and the overall downward trend in a single visual snapshot.
Visualizing Dropout Trends by Group: Box Plot of Distributions (1975–2013)
This box plot shows how dropout rates varied over time for each group. The taller boxes for Hispanic and Black students indicate a wider range of dropout rates, meaning more fluctuation year to year. Hispanic students had the highest overall rates, while White students had the lowest and most consistent rates. The line inside each box shows the median: Hispanic students consistently had a higher midpoint compared to the other groups. This view helps us quickly compare spread, typical values, and identify which groups experienced more variation in dropout rates over nearly four decades.
Your turn
Your turn
Choose a research question related to high school dropout rates, then create a graph that helps answer it using the data provided.
Forecasting
Forecasting
Will dropout rates continue to decline, and will different demographic groups converge by 2025?
Will dropout rates continue to decline, and will different demographic groups converge by 2025?
Predict rates for Black Male students based on 1975–2013 data
Predict rates for Black Male students based on 1975–2013 data
1
.Fit a Time Series Model
We’ll use TimeSeriesModelFit to model each group’s dropout rates from 1975–2013.
We’ll use TimeSeriesModelFit to model each group’s dropout rates from 1975–2013.
2
.Forecast Future Rates
We’ll forecast from 2014 to 2025 (12 years).
We’ll forecast from 2014 to 2025 (12 years).
3
. Visualize Predictions
We’ll overlay the historical data and future projections with confidence bands.
We’ll overlay the historical data and future projections with confidence bands.
Forecasting Dropout trend for Black Male students
We extract our forecast values for Black male students:
Calculate MAE and RMSE
Calculate MAE and RMSE
Mean Absolute Error (MAE) ≈ 0.77 and Root Mean Squared Error (RMSE) ≈ 0.92. On average, the model’s predictions were quite close—less than one percentage point off each year. The slightly higher RMSE means there were a few bigger mistakes, but most predictions were accurate.
To improve visual clarity, we created a table comparing actual dropout rates for Black males (2014–2022) with our model’s predictions. The final column shows the absolute error for each year.
Table: Forecast vs. Actual Dropout Rates
Table: Forecast vs. Actual Dropout Rates
This comparison highlights that the model generally performed well, especially before 2020. Errors increased slightly in later years, likely due to unexpected events like COVID-19, which were not part of the training data. This suggests the model is useful for trend forecasting but could be improved by including external factors.
Plot Forecast vs. Actual
This plot helps us clearly see the gap between predicted and actual dropout rates over time. While the model captured the overall downward trend, it underestimated recent increases. The discrepancy likely stems from real-world factors not included in the model, such as the impact of COVID-19, changes in education policy, or shifts in social and economic conditions. These kinds of external influences can cause sudden changes in data that simple time series models can’t predict. The visual comparison makes these differences easy to identify.
Comparative Trend Analysis
Comparative Trend Analysis
To better understand patterns in high school dropout rates, we explored how trends differ across race and gender groups over time. Our analysis focuses on comparing male and female dropout rates within each racial category, examining how gaps have changed, and identifying which groups have shown the most consistent patterns.
Trend Analysis
Trend Analysis
Do you notice any differences in how male and female dropout rates changed within each racial group?
Stability
Stability
Which group shows the most consistent (least variable) dropout rate over time?
We want to find out which group’s dropout rate changed the least over the years. A smaller standard deviation means more stability.
We want to find out which group’s dropout rate changed the least over the years. A smaller standard deviation means more stability.
This code tells us which group had the most stable dropout rate over the years by computing how much their data went up and down. Based on the standard deviations, White students had the most stable dropout rate over time, followed by Hispanic Male students. Black Male students had the most variable dropout rates, which may reflect greater shifts in educational access or social support across years. This tells us that not all groups experienced change the same way, and as a result, some groups may need more consistent support to stay in school.
Comparative Insight
Comparative Insight
Do Hispanic students have dropout rates more similar to Black or White students?
Compare the trends of Hispanic dropout rates to both Black and White students and determine which group they more closely follow.
Compare the trends of Hispanic dropout rates to both Black and White students and determine which group they more closely follow.
We compared the dropout rates of Hispanic students to both Black and White students to determine which group they most closely resembled. To do this, we measured the average absolute difference in dropout rates across years. The average difference between Hispanic and Black students was 14.42%, while the difference between Hispanic and White students was 20.52%.
All in all, Hispanic dropout trends were more aligned with Black students over time.
All in all, Hispanic dropout trends were more aligned with Black students over time.
Your Turn: Exploring Dropout Trends Among Female Students
Your Turn: Exploring Dropout Trends Among Female Students
You just saw how we compared Hispanic male dropout rates to those of Black and White male students. Now it’s your turn to investigate a similar question—but with female students.
Compare the dropout trends of Hispanic female students to those of Black female and White female students.
What You’ll Do:
Use TimeSeriesResample to align the yearly dropout data.
Compute the average absolute difference between:
Compare the dropout trends of Hispanic female students to those of Black female and White female students.
What You’ll Do:
Use TimeSeriesResample to align the yearly dropout data.
Compute the average absolute difference between:
1
.Hispanic female and Black female dropout rates.
2
.Hispanic female and White female dropout rates.
3
.Compare the two values and draw a conclusion.
4
.Once you’re done, ask yourself: Whose dropout pattern does the Hispanic female group follow more closely? Why might that be?
Working with LLMs in Wolfram Language
Working with LLMs in Wolfram Language
What can LLMs help us do?
What can LLMs help us do?
LLMs (Large Language Models) can help us understand patterns in complex data by generating explanations, summaries, or hypotheses in plain language. Wolfram Language lets us combine LLMs with statistical tools—so we can analyze trends and ask questions like a data scientist.
Summarizing Dropout Trends with LLM
Summarizing Dropout Trends with LLM
Let’s say we want to generate a plain-English summary of how dropout rates changed for Black male students from 1975 to 2013. Wolfram has built-in LLM functions to help.
First, we extracted the dropout rate data and we can see values over time, including dates and percentages. We then We transposed the data into {date, value} pairs to provide structure:
First, we extracted the dropout rate data and we can see values over time, including dates and percentages. We then We transposed the data into {date, value} pairs to provide structure:
We can send the following plain-English prompt to the built-in LLM in Wolfram Language:
Summarize the trend in dropout rate for Black male students from 1975 to 2013.

The trend in the dropout rate for Black male students from 1975 to 2013 shows a significant decline. In 1975, the dropout rate was relatively high, around 22.96%. Over the years, various educational policies and support programs likely contributed to a steady decrease in dropout rates among this demographic. By 2013, the rate had dropped to about 8.18%. This represents a substantial improvement over the nearly four-decade period, reflecting efforts to improve educational access and retention for Black male students. While there were fluctuations, including an initial spike in the early 1980s, the overall trend indicates progress toward reducing dropout rates.
The integration of policies like TRIO and the No Child Left Behind Act, despite some mixed effects, likely played a role in supporting this decline. However, real-world factors such as socio-economic conditions and educational reforms have influenced these trends, contributing to both the successes and challenges faced by Black male students in completing their education.
Overall, the data underscores the importance of continued efforts to ensure equitable educational opportunities for all students, with a focus on addressing the unique challenges faced by different demographic groups.
If you have any more specific questions or need further analysis, feel free to ask!
The LLM generated a clear and accessible summary of dropout trends for Black male students from 1975 to 2013. It noted key fluctuations and suggested policy-related explanations, with strong narrative flow and readability. However, it lacked quantitative detail: omitting exact percentages, variability, and references to visual data, limiting its usefulness for analysis or modeling.
Compare the trends of black and Hispanic students
The LLM summary effectively captured the overall decline in dropout rates for both Black and Hispanic students from 1975 to 2013. It highlighted key differences: Black students showed a steady decline from ~20% to 7%, while Hispanic students started higher (~35%) and declined more sharply after 2000, with greater fluctuations before that. These trends match the visual plots: Black students’ line is smoother, while the Hispanic line shows more variability. The output is clear and informative but could be improved by referencing specific years or percentages seen in the graphs.
We can also answer LLM-style questions programmatically using Wolfram Language.
Which demographic group had the largest absolute decline in dropout rate from 1975 to 2013?
Which demographic group had the largest absolute decline in dropout rate from 1975 to 2013?
The LLM’s answer is fluent but lacks grounding—it doesn’t cite specific percentages, data sources, or show how it reached its conclusion. By building an LLM Tool in Wolfram Language, we can ensure that responses are data-driven, transparent, and explainable. Instead of vague claims, the tool outputs structured, verifiable summaries like <|”Group” → “DropoutRateHispanic”, “Start” → 35.1, “End” → 12.7, “Decline” → 22.4> and can generate plots or walk users through each step. However, because LLMs generate outputs probabilistically, identical queries can yield slightly different phrasing or even divergent claims when re-run. This enables reliable, interpretable answers, especially in educational settings where accuracy and process matter.
Custom LLMTool to Provide Statistics Summary
Custom LLMTool to Provide Statistics Summary
To support robust, grounded reasoning with our dropout dataset, we created a custom LLM Tool called DropoutStatsSummary. Unlike a generic language model answer, this tool integrates Wolfram Language functions to analyze actual time series data per demographic group. The function computeDropoutStats[group_] extracts and computes descriptive statistics such as mean, min/max with corresponding years, standard deviation, and percent change from 1975 to 2013. The result is a structured summary grounded in the dataset.
We register this function as a tool with the following declaration:
We register this function as a tool with the following declaration:
We can test the tool by:
We can now ask the LLM a question like:
This LLM-generated summary, supported by the DropoutStatsSummary tool, gives a clear and data-based view of how dropout rates for Black males in the U.S. changed from 1975 to 2013. Over this time, the average dropout rate was about 14.4%, meaning a significant number of Black male students were leaving school before graduating. In 1975, the rate was at its highest—23%—but it dropped to just 8% by 2007. While the rates did change from year to year, they followed a steady downward trend, with a total drop of nearly 15 percentage points, or about 64% overall. This shows real progress in helping more Black male students stay in school and graduate. These improvements likely came from efforts like better support programs, changes in education policy, and stronger community resources. What makes this tool especially useful is that it gives specific numbers and years, helping us understand the full picture more clearly than a general answer from an AI.
LLMTool2 Output
LLMTool2 Output
The DropoutGapSummary LLMTool effectively generated a clear summary comparing dropout rates between Black female and Hispanic female students from 1975 to 2013. It provided accurate descriptions, noting that Black female students had lower dropout rates on average by 12.2 percentage points. The tool also used a linear model to estimate how the gap changed over time, showing a steady increase of about 12.16 percentage points per year. The confidence interval (–13.2 to –11.1) helped show the estimate is reliable. The graph helped visualize how the gap changed, showing that the difference in dropout rates became smaller over time. While the table showed each year’s data, it was hard to read all at once, so it would be more useful in a different format. Overall, the tool worked well and showed how AI can help students understand real-world data through text, numbers, and graphs.
Statistics Helper Persona
Statistics Helper Persona
In Wolfram Language and its LLM-based tools, a persona is a predefined chat behavior profile that shapes how the AI responds in a conversation. Personas influence the AI’s tone, purpose, and point of view, and can be used to simulate particular roles, moods, or functional styles. You can think of a persona as a character or specialized assistant you can “activate” to tailor how an LLM interprets and replies to prompts.
Persona Code
The statHelper persona successfully interpreted the user’s natural-language prompts by routing them to the appropriate analytical tools. When asked to compare dropout rates between Black and Hispanic female students, it invoked the DropoutGapSummary function to generate a time series plot and compute a linear model of the gap over time. It returned both a statistical summary and a visual representation of the trend, indicating a persistent gap that narrowed slightly over the years. When asked about the trend for Black female students specifically, the persona correctly used the DropoutStatsSummary tool to retrieve key summary statistics, including mean, minimum, and maximum dropout rates, as well as overall percent change. These results demonstrate that the persona was able to parse domain-relevant keywords such as “gap,” “compare,” and “trend,” and respond with precise, data-backed outputs. Overall, the statHelper persona shows how a well-defined LLM interface, paired with targeted statistical functions, can guide students through complex analyses with clarity and autonomy.
Your Turn: Choose a New Data Type to Explore
Your Turn: Choose a New Data Type to Explore
Now that you’ve analyzed trends using time series data, it’s your turn to select a different type of variable from the Variable Type Data Analysis Taxonomy and repeat a similar investigation. You can go to the Wolfram Data Repository and choose a dataset that interests you.
Start by choosing a new variable type: such as discrete numeric, ordinal, or Boolean, and refer to the taxonomy to see which statistical techniques apply. For example, if you choose a discrete numeric variable like age or grade level, you might compute descriptive statistics, examine group differences, or visualize distributions with box plots or histograms. If you choose a Boolean variable, logistic regression or group comparisons might be appropriate.
Use the taxonomy as your guide:
◼
What kinds of comparisons or trends make sense for the variable you chose?
◼
What visualizations or models could help interpret the data?
◼
Can you build a similar helper tool to summarize or compare values?
Try structuring a prompt to statHelper or a custom tool you’ve built—then interpret the results just as you did with the dropout time series. This is your chance to apply computational thinking to a new context and deepen your understanding of variable-aware analysis.
Concluding Remarks
Concluding Remarks
Summary
Summary
This project shows that high school students, with the right tools and framing, can engage meaningfully in data science. By analyzing real dropout data from the Wolfram Data Repository, students explore time series patterns, compare demographic groups, and draw conclusions using statistical reasoning. Visualizations—like bar charts, line graphs, heat maps, and box plots—help make complex data trends easier to interpret. With built-in tools like statHelper, learners can ask natural questions and receive dynamic, computational answers, making the data science process more intuitive and accessible.
Future
Future
In the future, this notebook could be expanded to include forecasting tools that let students model future dropout trends or simulate the effects of interventions. More AI features could guide students through more open-ended investigations or suggest visualizations based on their questions. Additional modules could bring in other datasets—such as college enrollment or economic indicators—to allow for richer, cross-variable analysis. These features would deepen student engagement and make the experience even more relevant to real-world social inquiry.
“What will limit us is not the possible evolution of technology, but the evolution of human purposes.”
— Stephen Wolfram
“What will limit us is not the possible evolution of technology, but the evolution of human purposes.”
— Stephen Wolfram
Acknowledgments
Acknowledgments
Thank you to the Wolfram Summer School for the opportunity to build this project, and to my mentor, Paul Abbott, for his guidance throughout. I’m also deeply grateful to the TAs: John McNally, Phileas Dazeley-Gaist, and Christian Pasquel for their support. Special thanks to my incredible peers, including Floe Foxon, Xerxes D. Arsiwalla (Wolfram Physics director), and Robyn Gausman-Burnett, whose insights and encouragement were invaluable. Finally, heartfelt thanks to my dear Bryan Eng, whose warmth and care sustained me throughout this journey.
References
References
1
.Wolfram Research. (n.d.). Wolfram Data Repository. Wolfram Cloud. https://datarepository.wolframcloud.com/
2
.Wolfram Alpha LLC. (n.d.). WolframAlpha. https://www.wolframalpha.com/
3
.Wolfram, S. (2024). An introduction to computational thinking. https://www.wolframcloud.com/obj/computational-thinking/site/
Cite This Notebook
Cite This Notebook
Who drops out and why? Data storytelling in Wolfram Language with LLMs
by Daria Smyslova
Wolfram Community, July 8, 2025
https://community.wolfram.com/groups/-/m/t/3494955
by Daria Smyslova
Wolfram Community, July 8, 2025
https://community.wolfram.com/groups/-/m/t/3494955