I cannot get the ListLinePlot at the bottom on the notebook to plot the meanPath and the lowerBoundPath.
Simulation:
Simulation:
Uses RandomVariate & RandomFunction to perform Simulations
In[]:=
(*1.Definetheprocessparameters*)mu=0.000570304;sigma=0.0100655;initialPrice=20.46;(*2.DefineaGeometricBrownianMotionprocess*)(*Note:GBMusesdrift=mu+(sigma^2)/2tomatcharithmeticmeanreturns*)gbmProcess=GeometricBrownianMotionProcess[mu+(sigma^2)/2,sigma,initialPrice];(*3.Simulate1,000pathsfor30daysusingRandomFunction*)simData=RandomFunction[gbmProcess,{0,30,1},1000];(*4.Cleanlyplottheresultingtimeseriespaths*)ListLinePlot[simData,Frame->True,PlotLabel->"RandomFunction Price Paths",FrameLabel->{"Days","Price"}]
Out[]=
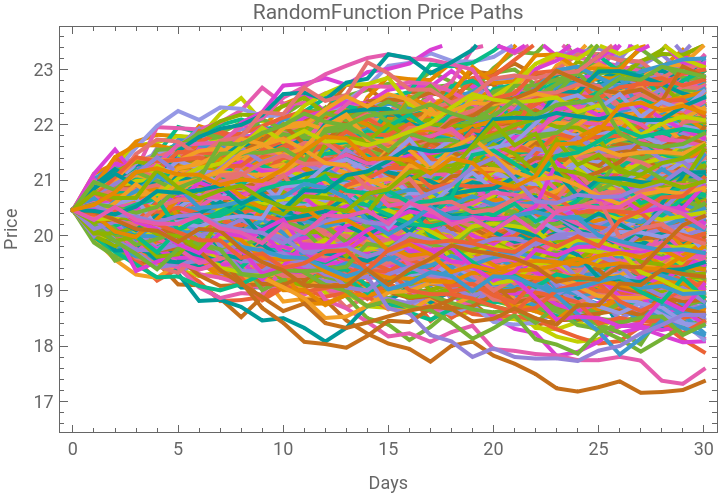
Calculate: Mean, StandardDeviation and Quantile using simData and 30 days.
In[]:=
Mean[simData[30]]
Out[]=
20.8475
In[]:=
StandardDeviation[simData[30]]
Out[]=
1.17274
In[]:=
Quantile[simData[30],0.05]
Out[]=
18.9347
In[]:=
simData["Properties"]
Out[]=
{Components,DateList,DatePath,DatePaths,Dates,FirstDates,FirstTimes,FirstValues,LastDates,LastTimes,LastValues,Part,Path,PathComponent,PathComponents,PathCount,PathDates,PathFunction,PathFunctions,PathLength,PathLengths,Paths,PathTimes,SliceData,SliceDistribution,TimeList,Times,TimeZone,ValueDimensions,ValueList,Values}
In[]:=
(*1.RunthestatisticsontheFULLsimDataobjecttoget30-daypaths*)meanPath=Mean[simData];lowerBoundPath=Quantile[simData,0.05];upperBoundPath=Quantile[simData,0.95];(*2.PlotusingEvaluatetocorrectlymapthefulltime-seriesdata*)ListLinePlot[Evaluate[{meanPath,lowerBoundPath,upperBoundPath}],Frame->True,PlotStyle->{Black,Red,Green},PlotLabel->"Predictive Price Corridors",PlotLegends->LineLegend[{Black,Red,Green},{"Expected Path (Mean)","5th Percentile (Floor)","95th Percentile (Cap)"}]]
Out[]=
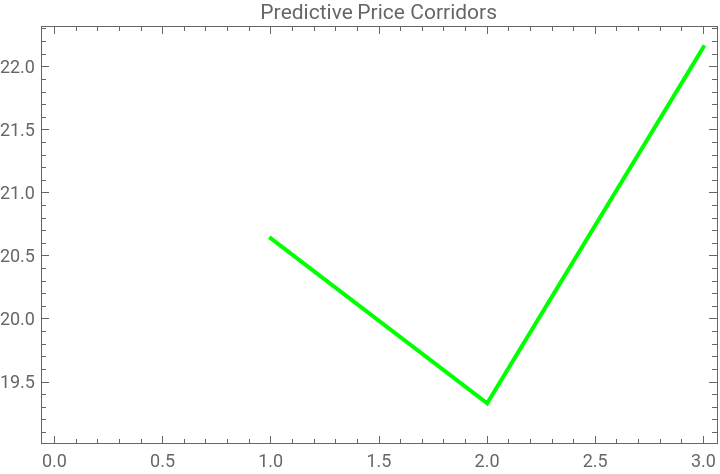


**ListLinePlot seems to be missing: Expected Path(Mean) and 5th Percentile (Floor) values.