Growth rates of non-linear and non-exponential scaling Wolfram Models
by Juan Pablo Varela
University of Massachusetts Boston
by Juan Pablo Varela
University of Massachusetts Boston
This project is aimed at the study of exotic growth in spatial hypergraphs used in the Wolfram Physics Project. Typical growth in the number of edges and vertices scale at a linear and exponential rate, with those rates being measured and classified in a previously. Here I attempted to observe non-linear and non-exponential growth, which began with a breadth-first search of models with various rewrite signatures and initial states. Filters were constructed and expanded that discarded those typical growths out of large pools of models stemming from various rule signatures, and allowed for easier exotic searches. The observed exotic growths all fit the form of a univariate quadratic polynomial, showing perfect quadratic growth or that of triangular numbers. This type of growth was observed over a wide range of signatures, though never when a single rule was applied. Future steps should be to use multiple rules over more complicated signatures, of arity 4 and 5, and develop this classifier into a function which may possibly identify models via the form of their growth. Future work should also continue to attempt to find growth rates from which potential bounds on the cosmological constant may be derived.
◼
Custom functions and example can be found at https://github.com/Juan-Varela11/WWS22-GrowthRates
Background
Background
Spatial hypergraphs are one of the types of graphs used in the Wolfram Physics Project framework, which in the large-scale limit may begin to show features of continuous space. There is the potential that these hypergraphs represent the configuration of the universe on a spacelike hypersurface at any given time. One of the important properties to measure of a hypergraph is its growth rate i.e. the rate at which its number of edges and vertices change over each generation.
Over all forms of signatures and number of rules imposed on some set of initial conditions, it is typically observed that the growth rates scale linearly or exponentially. There have been no other forms of growth scaling observed before. The aim of this project is to then delve further in and observe possible non-linear and non-exponential growth rates in these spatial hypergraphs. Arity 3 and 4 were looked at in particular, of different signatures and up to 2 rules imposed at a time, to look for these exotic growths.
Over all forms of signatures and number of rules imposed on some set of initial conditions, it is typically observed that the growth rates scale linearly or exponentially. There have been no other forms of growth scaling observed before. The aim of this project is to then delve further in and observe possible non-linear and non-exponential growth rates in these spatial hypergraphs. Arity 3 and 4 were looked at in particular, of different signatures and up to 2 rules imposed at a time, to look for these exotic growths.
Typical Growth Rates
Typical Growth Rates
Linear
Linear
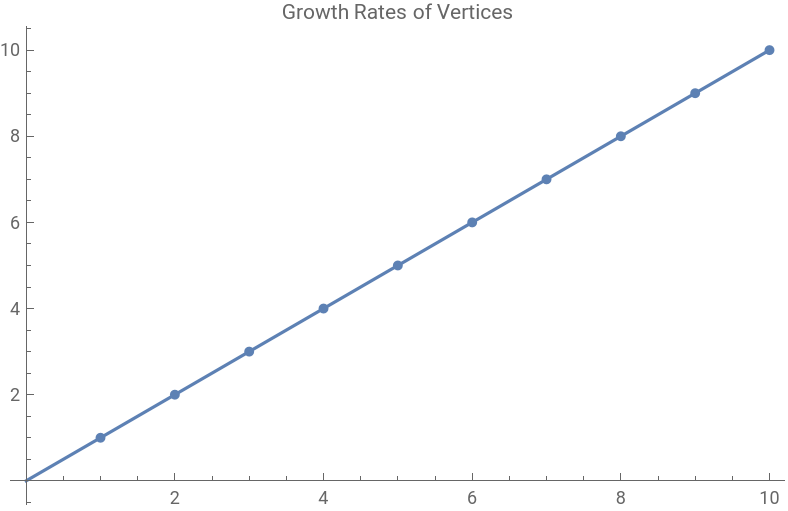
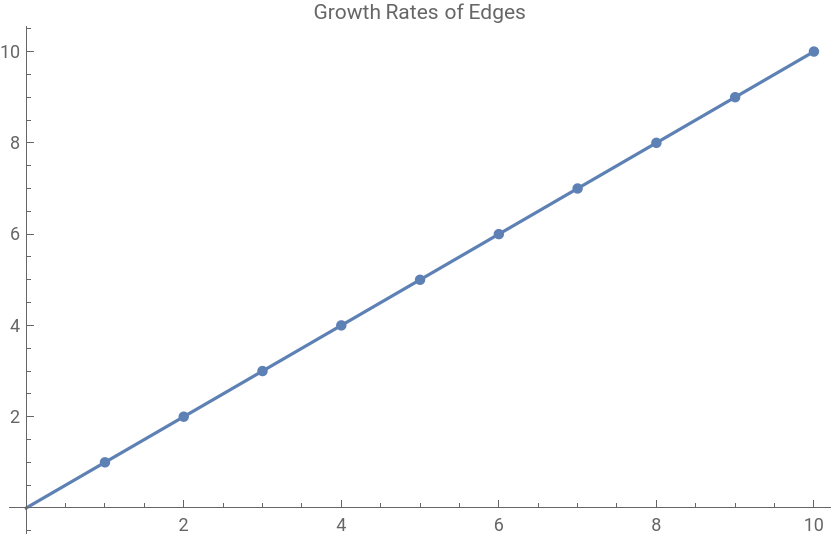
A commonly observed growth rate scales linearly. This is present in all forms of model signatures, no matter the number of applied rules. These may be exactly linearly, linearly with some distortion, or linear step growth.
Linear growth rate observed in a model of stemming from a signature of :
1
2
1
2
1
3
In[]:=
linmodel=ResourceFunction["WolframModel"][{{1,2}}->{{1,2},{1,2,3}},Automatic,10,{"VertexCountList","EdgeCountList"}];Show[Plot[x,{x,0,10}],ListPlot[linmodel[[1]]],PlotLabel"Growth Rates of Vertices"]Show[Plot[x,{x,0,10}],ListPlot[linmodel[[2]]],PlotLabel"Growth Rates of Edges"]
Final State Plot of Linear Model:
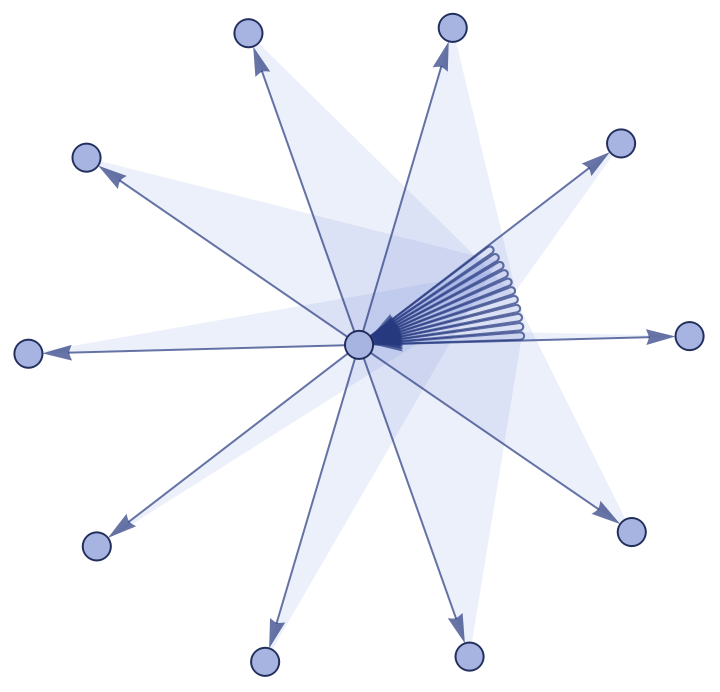
ResourceFunction["WolframModel"][{{1,2}}->{{1,2},{1,2,3}},Automatic,10]["FinalStatePlot"]
Out[]=
Layered Causal Graph of Linear Model:
ResourceFunction["WolframModel"][{{1,2}}->{{1,2},{1,2,3}},Automatic,10]["LayeredCausalGraph"]
Out[]=

Exponential
Exponential
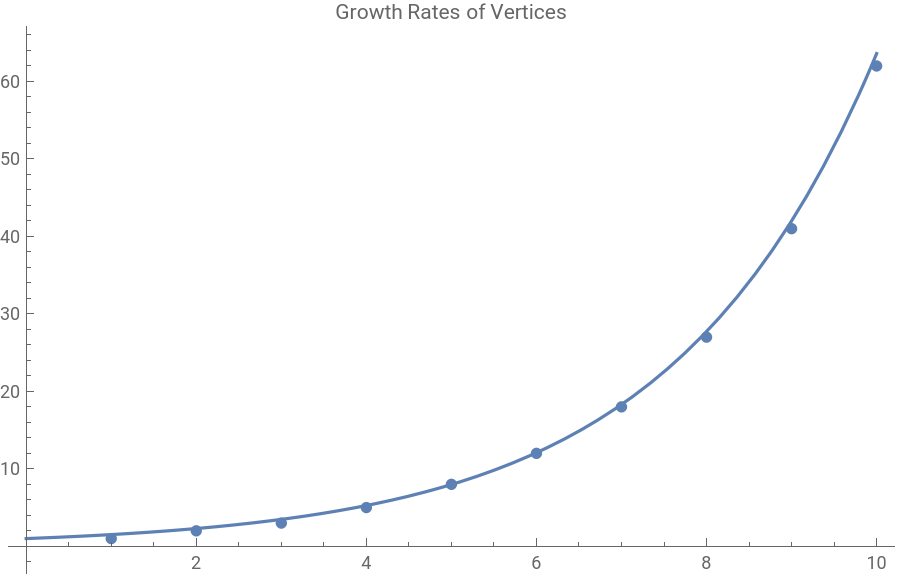
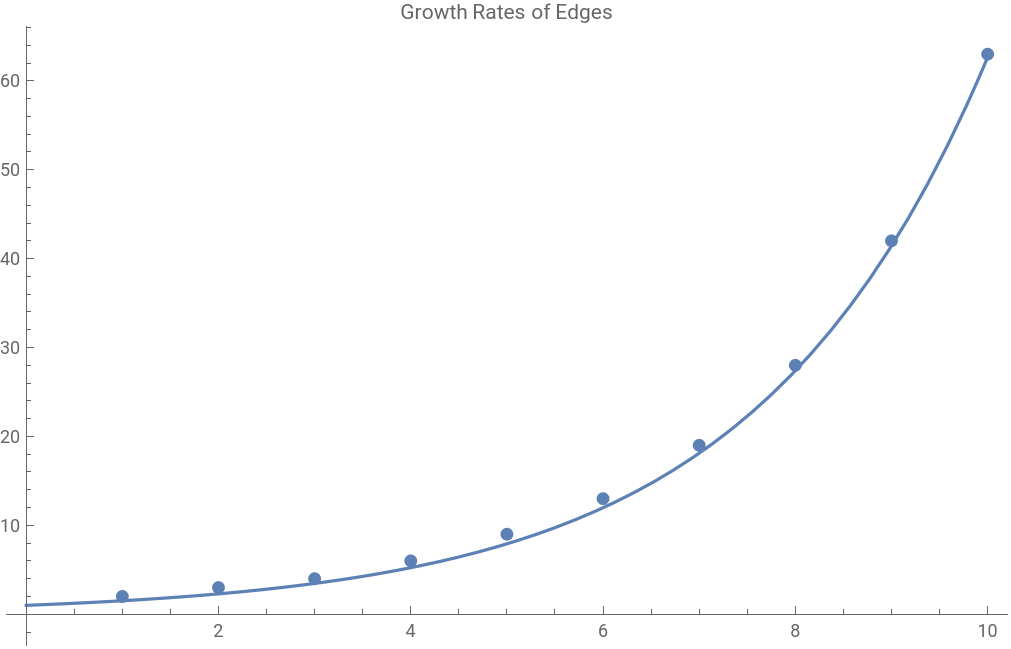
Alongside linear scaling, the other most commonly observed growth rate are those which scale exponentially. This includes integer base growth rate, non-integer base growth rate, as well as step growth. Not all examples of linear and exponential growth rates are shown here, but are explained in detail in a past Wolfram Summer School [1].
Exponential growth rate observed in a model of stemming from a signature of :
2
2
3
2
In[]:=
expmodel=ResourceFunction["WolframModel"][{{2,1},{3,1}}->{{2,1},{3,1},{4,1}},Automatic,10,{"VertexCountList","EdgeCountList"}];Show[Plot[,{x,0,10}],ListPlot[expmodel[[1]]],PlotLabel"Growth Rates of Vertices"]Show[Plot[,{x,0,10}],ListPlot[expmodel[[2]]],PlotLabel"Growth Rates of Edges"]
0.9685393099724513x
1.5353398170629722
0.9789147074941954x
1.5260608973966097
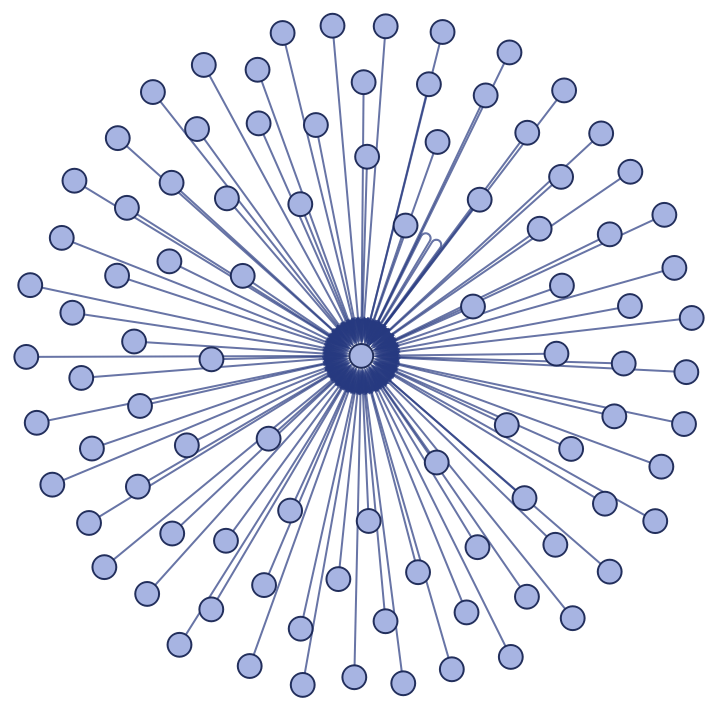
Final State Plot of Exponential Model:
ResourceFunction["WolframModel"][{{2,1},{3,1}}->{{2,1},{3,1},{4,1}},Automatic,10]["FinalStatePlot"]
Out[]=
Layered Causal Graph of Exponential Model:
Quadratic Growth Rates
Quadratic Growth Rates
Quadratic Polynomial Scaling
Quadratic Polynomial Scaling
Final State Plot of above quadratic polynomial growth model:
Layered Causal Graph of above quadratic polynomial growth model:
Triangular Number Scaling
Triangular Number Scaling
Final State Plot of above triangular number growth model:
Layered Causal Graph of above triangular number growth model:
Growth Rate Comparisons
Growth Rate Comparisons
Plotted below are the different growth rates - linear,exponential, and the three quadratic growth expressions - so they can be clearly compared and differentiated.
Plot comparing different growth rate expressions:
Cosmological Implications
Cosmological Implications
If these spatial hypergraphs represent the configuration of the “instantaneous” universe on a spacelike hypersurface, it is reasonable to assume that the expansion (growth) rates of these hypergraphs can be related to the expansion rate of the universe. So if more exotic and interesting (higher degree polynomial, non-polynomial) growth rates can be found, perhaps those expressions may be used to derive some form of bounds and approximation of the cosmological constant which is used in LCDM models.
Concluding remarks
Concluding remarks
Exotic growth rate observed are quadratic in nature. While it is important that quadratic growth was measured in spatial hypergraphs, it is not of particular interest. For future developments, there should be both a study in rules involving higher arities as well as models stemming from more than just 2 rules. The highest arity tested was arity 4, and not extensively, so combining different signatures of arity 4 and higher may prove fruitful. Also to test how multiple imposed rules, 3 or more, affect growth would be of interest as the highest number of applied rules in this project was 2. The possibility to derive bounds on the cosmological constant via a growth rate expression of one of these hypergraphs should still be sought after.
If developed further and other unknown growth rates are observed, I do believe this classifier has the potential to act as a function which if applied to a model could tell you how its growth rate scales. The utility of such a tool, which could output “Linear”, “Exponential”, “Quadratic”, etc. via the input of the model itself, could act a quick way to classify your models and perhaps allow the user to search models up via growth rates.
If developed further and other unknown growth rates are observed, I do believe this classifier has the potential to act as a function which if applied to a model could tell you how its growth rate scales. The utility of such a tool, which could output “Linear”, “Exponential”, “Quadratic”, etc. via the input of the model itself, could act a quick way to classify your models and perhaps allow the user to search models up via growth rates.
Keywords
Keywords
◼
WolframPhysicsProject
◼
Growth Rates
◼
Cosmology
◼
Spatial Hypergraphs
Acknowledgment
Acknowledgment
My first thanks goes out to Kyle Leaf, who without his help and guidance, I would have been stuck on some problems for too long and would never have thought of different ways to look at this project. I must also thank Stephen Wolfram, Xerxes Arsiwalla, and all the other organizers and lecturers for all organizing such an amazing experience, and giving me the opportunity to work on such a amazing project and learn so much over the course of two weeks.
References
References
◼
[2] S. Wolfram “ A Class of Models with the Potential to Represent Fundamental Physics” https://www.wolframphysics.org/technical-introduction
◼
[3] J. Gorard arXiV:2004.14810
◼
[5] Y. Zeschke arXiv:2102.03321