Abstract
This article draft analyzes the paradox that 5-4 decisions of the United States Supreme Court lean conservative. They are about 58% conservative rather than even. The phenomenon is explained by the ideological proximity of the median justice to the next conservative justice. A further division of the decisions into those in which justices align ideologically and those in which they do not reveals that the two subsamples are quite different. Only those decisions in which the justices align ideologically present the phenomenon of the conservative paradox and only in those decisions does the median’s location explain the outcomes. A thought exercise comparing the selection of justices in the recent times to the turn of the 20th century shows that these phenomena are consistent with the political system selecting the justices on the agreement of their interpretive positions or legal philosophy with the appointing President’s party in a few major dimensions which explain the phenomenon in aligned decisions but the justices retain their positions in other dimensions producing the absence of the conservative paradox in the rest. In other words, the justices are not being ideological but consistently pursue their legal philosophies. Rather, they are selected for the agreement of their philosophies with the appointing party in the few salient dimensions that govern the selection of justices.
Summary
The article divides into demonstrating the conservative paradox and the analysis of political attitudes of the justices. The demonstration of the conservative paradox consists of (1) the corresponding statistical tests (various tests); (2) showing that in every long-lived composition of the Supreme Court, 5-4 decisions were more than 50% conservative; (3) that if the terms of the Supreme Court were aggregated into 15-term period, every period had more than 50% conservative decisions and that this is mostly also true for aggregations terms by three; and (4) two audits seeking to show that the subjectivity of assigning the liberal versus conservative label to decisions does not reveal a bias in the database.The analysis consists of (1) the absence of a theory justifying departures from an even division of conservative and liberal decisions; (2) the absence of an explanation based on which party controlled the senate during appointments; (3) an exploration of three potential ways for 5-4 divisions to occur based on estimates of each justice’s ideology, where we see that the one that assumes justices are strategic has the greatest explanatory power. The dominant explanation of how 5-4 divisions occur is that when the remaining justices divide 4-4, the ideologically median justice is more likely to join the side that has a justice ideologically closer to the median. In other words, the median tends to join the next closest justice. This would be consistent with a theory that the more extreme justices on each side recognize that insisting for a more extreme interpretation would cost them the majority, therefore they are willing to compromise to at least the position of the justice of their side that is closest to the median. Call those two justices, who are neighboring the median, the next liberal justice and the next conservative justice. Along the way, the phenomenon appears most strongly in 5-4 decisions during the first year of a new composition, i.e., decisions made while the most recent appointee is not as well known by colleagues and litigants. Therefore the analysis focuses on first-year 5-4 decisions.If five-justice coalitions depend on the distances from the median justice to the next conservative or liberal, then the conservative paradox may be explained if the median justice has tended to be closer to the next conservative justice than the next liberal justice. A probit regression of the political slant of a decision against the distances to the next liberal and the next conservative justice reveals this to be true. A 3D graph shows this effect. This conclusion raises a corollary concern that decisions may generally depend on the political attitudes of justices rather than their positions on legal interpretation. To explore this, the article separates the 5-4 decisions into those in which the justices align by ideology and those where they do not. The justices align by ideology if the four liberals vote for the liberal outcome and the four conservatives vote for the conservative outcome, leaving the median to determine the outcome. It turns out that less than 50% of the 5-4 decisions have the justices aligned by ideology. In that subsample, the distances to the next liberal and the next conservative justices have an even greater explanatory power in the probit model of whether a decision is conservative, which is visible in a 3d graph that follows the patterns of the previous one. The remaining decisions, the subsample where justices do not align by ideology, reveals no explanatory power in this model and does not produce the conservative paradox: when justices do not align by ideology, 5-4 decisions are slightly less than 50% conservative. To validate the importance of ideological distances, the article shows that they also determine the fraction of decisions where the justices align by ideology and shows that decisions other than during the first year of a composition behave consistently with the analysis.The difference between the two subsamples is explained by recognizing that legal interpretive positions are multidimensional and the system of appointments of justices operates only on those dimensions that the political system considers salient for determining whether a candidate to become a justice is liberal or conservative. For example, a candidate may favor narrow federal authority (and broad state authority; this is strongly considered a conservative position in the last 60 years) and favor tight control over juries (as opposed to allowing juries to hear questionable evidence or nullify laws; the political slant of this interpretive attitude is unclear but some would treat is as liberal). The conservative Republican party may appoint such a justice because a Republican president will consider such a candidate conservative due to the candidate’s position on federal authority. The candidate’s position of juries is not salient for the political system. The phenomenon where the ideology of justices determines the outcomes in only decisions in which justices align by ideology is consistent with the idea that the justices consistently follow their interpretive principles, their judicial philosophies. Yet, those only produce “political” outcomes in those decisions that involve “political” topics, because there the justices have been appointed due to their philosophies’ agreement with the parties. In the remaining matters, where justices do not align by ideology, the justices continue to pursue their own philosophies or interpretive attitudes but the outcomes are not political because the justices were not selected for their views on those dimensions.
2
χ
Computationally Interesting Steps
The highlight, I think, of the article is the two 3D graphs, the first that reveals some explanatory power of the distance to the next liberal or conservative justice, and the second which shows that power to be much greater when applied only to the subsample of 5-4 decisions where the justices align by ideology. The complexity and novelty of those graphs requires that they be introduced gradually. I use DynamicModule[ . . . Dynamic@Show[ . . . ],SaveDefinitionsTrue] to produce the graph with checkboxes that allow the audience to first see the placement of only two compositions of the Court (those defined by the appointments of Breyer and Goldberg), then see all the compositions, and then also see the surface that corresponds to the probit regression and, finally, the matching linear regression that gives a metric of the variation in the data that the model explains (the ). The 3D graphs use a custom function for placing text in a 3D graph so it stays in a constant relative position as the user rotates the graph. In earlier versions, that function relied on the public-domain Hershey fonts, but in more recent versions of Mathematica, its rasterizing powers allow the use of any font (see the definition of the function text3D[ string, locationParameters]:=. . . DiscretizeGraphics[Text[Style[ . . . ], . . . ], options]; special thanks to the StackExchange community for helping with the adaptation of this function and many other coding issues).
As a matter of database manipulation, some may be interested in the transformation of the justice-centered database ( http://supremecourtdatabase.org/data.php ) from each justice’s vote being one record (one row) to the convention of the case-centered version of the database, where each case is a row, followed by the votes of the justices, despite that the number of votes varies depending on recusals and vacancies. Of related interest is the adaptation of the database of the justices’ ideological positions (the Martin & Quinn ideal point estimates, see ( https://en.wikipedia.org/wiki/Ideological_leanings_of _United _States _Supreme _Court _justices ) to correspond to each composition and term of the Court, despite that compositions change during terms but the database reports ideologies by term.
Generally, all graphs seek to reveal information through the use of text in the graph that reveals which composition of the Court each data-point corresponds. Therefore, graphs are heavily customized by being produced through graphics primitives rather than graph-producing functions.
2
R
As a matter of database manipulation, some may be interested in the transformation of the justice-centered database ( http://supremecourtdatabase.org/data.php ) from each justice’s vote being one record (one row) to the convention of the case-centered version of the database, where each case is a row, followed by the votes of the justices, despite that the number of votes varies depending on recusals and vacancies. Of related interest is the adaptation of the database of the justices’ ideological positions (the Martin & Quinn ideal point estimates, see ( https://en.wikipedia.org/wiki/Ideological_leanings_of _United _States _Supreme _Court _justices ) to correspond to each composition and term of the Court, despite that compositions change during terms but the database reports ideologies by term.
Generally, all graphs seek to reveal information through the use of text in the graph that reveals which composition of the Court each data-point corresponds. Therefore, graphs are heavily customized by being produced through graphics primitives rather than graph-producing functions.
Initialize
Quasi Standard
Quasi Standard
Database Read/Write
Database Read/Write
Conservative Ratio Phenomena
Basic Descriptive Stats
Basic Descriptive Stats
Conservative Ratio of Long-Lived Compositions
Conservative Ratio of Long-Lived Compositions
Conservative Ratio of Periodic Aggregations
Conservative Ratio of Periodic Aggregations
Chi-Squared Tests of Cons Ratio of Different Vote Splits
Chi-Squared Tests of Cons Ratio of Different Vote Splits
In[]:=
Out[]//TableForm=
Vote Split | 9-0 | 8-1 | 7-2 | 6-3 | 5-4 |
Conservative | 1076 | 375 | 491 | 667 | 797 |
Liberal | 1456 | 396 | 463 | 577 | 569 |
Total | 2532 | 771 | 954 | 1244 | 1366 |
Exp. Cons. | 1266. | 385.5 | 477. | 622. | 683. |
Exp. Lib. | 1266. | 385.5 | 477. | 622. | 683. |
P-Value | 4.29211× -14 10 | 0.449471 | 0.364654 | 0.0107194 | 6.87558× -10 10 |
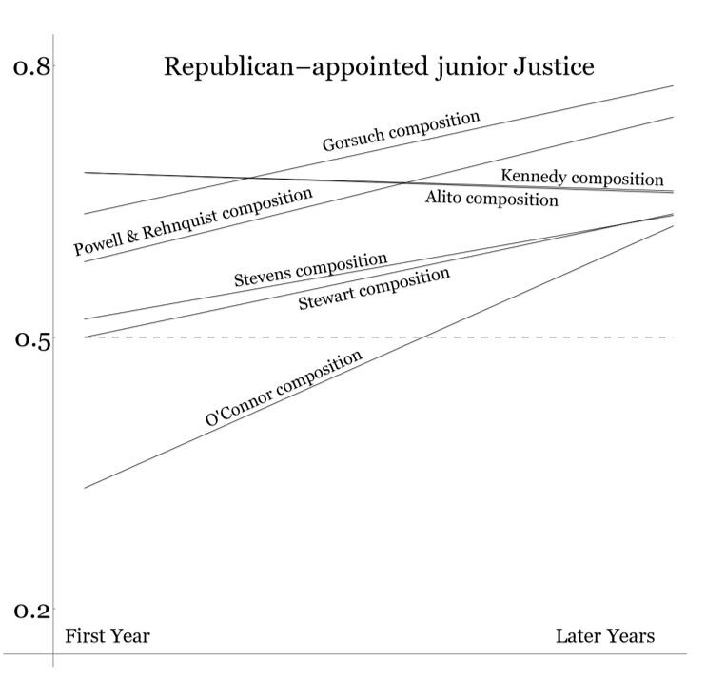
Appointing-Party Drift: Long Republican-Appointed-Junior Compositions
Appointing-Party Drift: Long Republican-Appointed-Junior Compositions
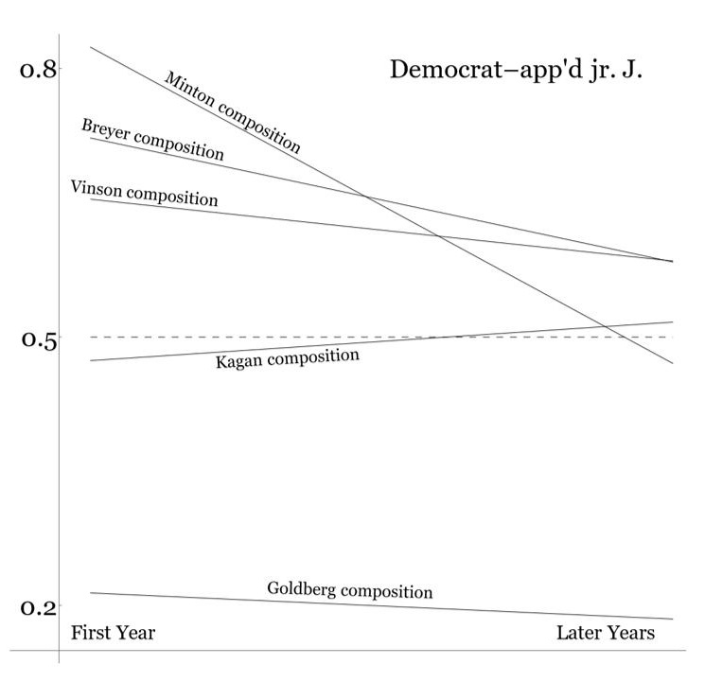
Appointing-Party Drift: Both parties, first year, later years
Appointing-Party Drift: Both parties, first year, later years
Appointing-Party Drift: Per Composition, Graph
Appointing-Party Drift: Per Composition, Graph
Code
Code
Graph
Graph
Political Attitudes Phenomena
Made Dynamic
Made Dynamic
Graph
Graph
Made Dynamic
Made Dynamic
Graph
Graph
Case Mix Graph & Probit
Case Mix Graph & Probit
Calculate weighted average distance for each natCt
Calculate weighted average distance for each natCt
Graph
Graph
Figure
Figure
Note how line is different than OLS would produce because probit deals with decisions one at a time.
Most visible in Roberts, for example, who only had two decisions, both aligned. So, in the graph Roberts seems as an outlier, but the fact that those are only two decisions does not mean the line had to be any closer to the Roberts aligned ratio
Most visible in Roberts, for example, who only had two decisions, both aligned. So, in the graph Roberts seems as an outlier, but the fact that those are only two decisions does not mean the line had to be any closer to the Roberts aligned ratio