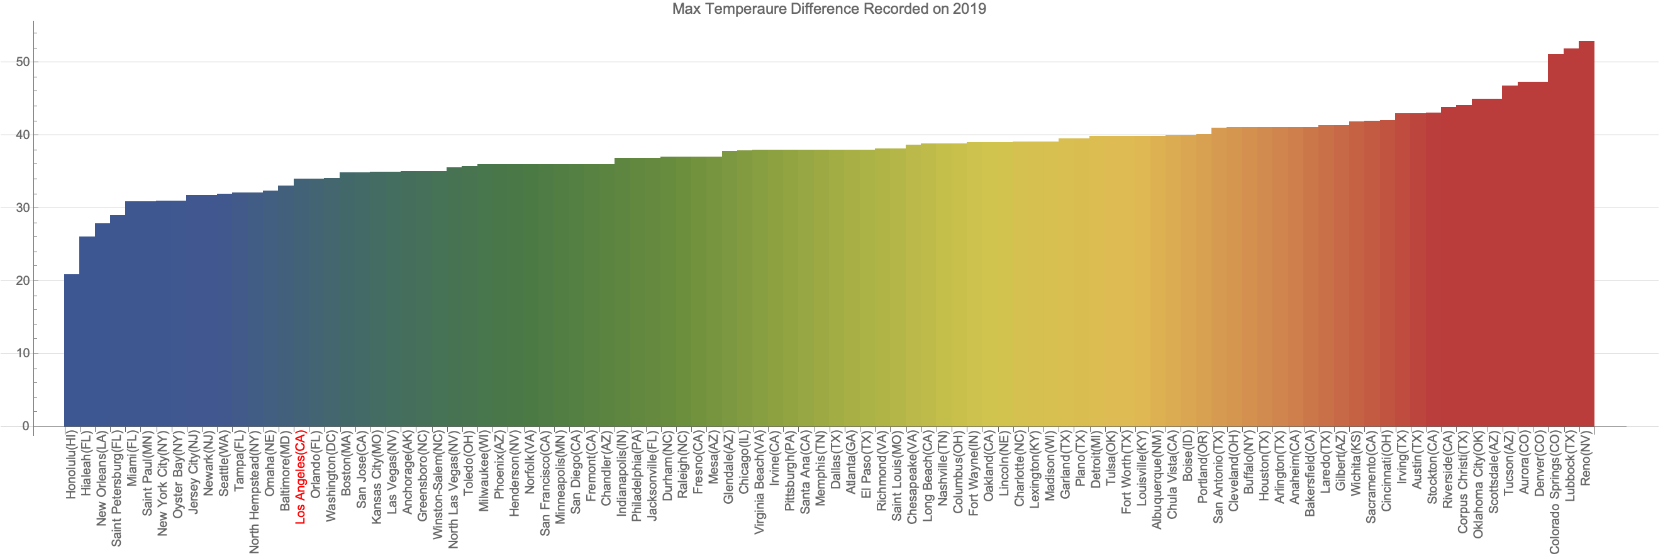
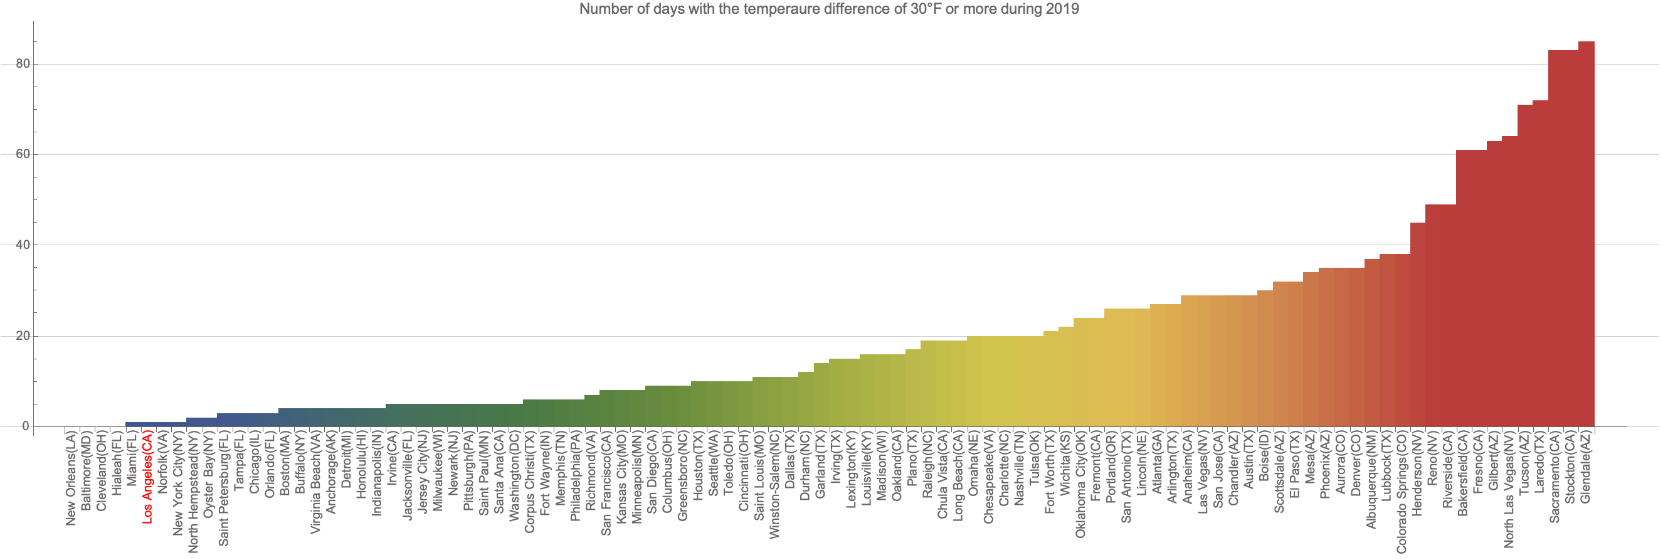
In a series of very short computational essays, I will explore some functionalities of Wolfram Language that are useful for data visualization and explorations. I wrote it for educational purposes, helping (mostly, beginner users) with exploring any topic computationally. In this essay, I will explore the maximum and minimum recorded temperature across 100 US cities with the largest population. The result is very interesting, e.g., during 2019 some cities have about 100 days with the temperature difference of 30°F or more! Also, the maximum recorded difference for 2019 was more than 50°F for Reno, NV.
Get data
Get data
Find 100 US cities in terms of population:
In[]:=
cities=EntityList@EntityClass"City",,TakeLargest[100];
Visualize the previous output:
In[]:=
cities//GeoListPlot
Out[]=
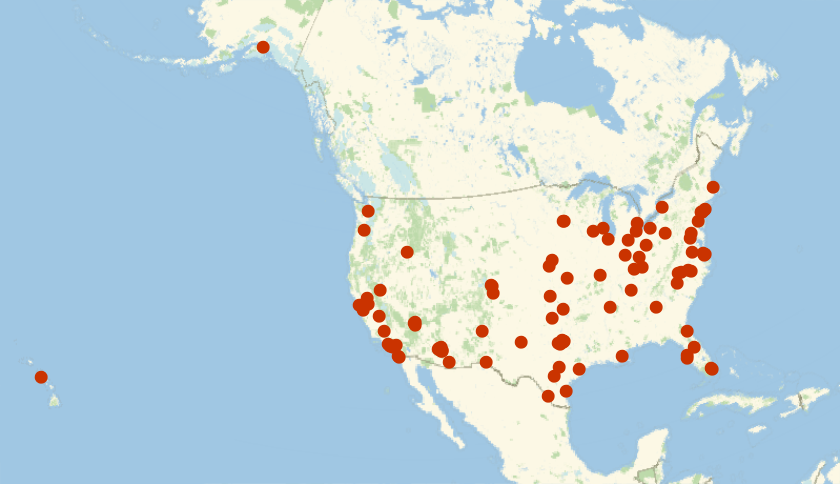
Find cities geo-location and put them all as GeoPosiiton[{loc1,loca2,...}]:
In[]:=
pnts=EntityValue[cities,"Position"]〚All,1〛//GeoPosition;
Find max temperature (daily) in °F during 2019:
In[]:=
max=WeatherData[pnts,"MaxTemperature",{{2019,1,1},{2019,12,31},"Day"},"NonMetricValue"];//AbsoluteTiming
Out[]=
{34.0759,Null}
Find min temperature (daily) in °F during 2019:
In[]:=
min=WeatherData[pnts,"MinTemperature",{{2019,1,1},{2019,12,31},"Day"},"NonMetricValue"];//AbsoluteTiming
Out[]=
{29.8468,Null}
Some viz on data
Some viz on data
Generate an association for max and min with keys as cities (city->{max,min}):
In[]:=
ascMaxMin=AssociationThread[cities,Transpose[{max,min}]];
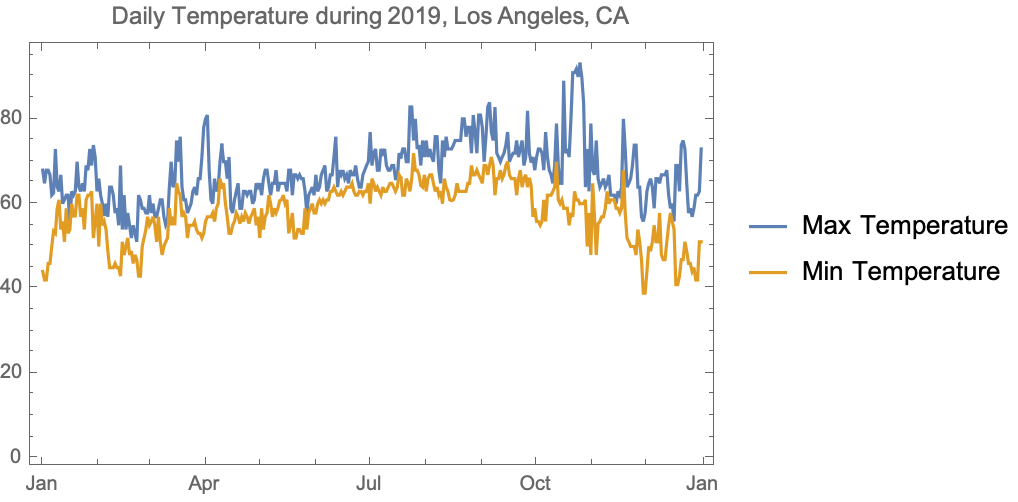
Visualize the data for Los Angeles, CA:
In[]:=
DateListPlotascMaxMin,{2019,1,1},PlotLegends{"Max Temperature","Min Temperature"},PlotLabel"Daily Temperature during 2019, Los Angeles, CA"
Out[]=
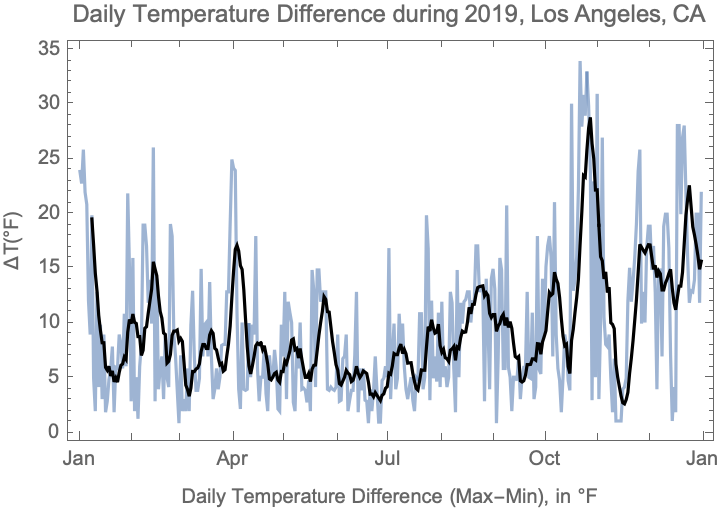
Visualize the temperature difference for Los Angeles, CA:
In[]:=
DateListPlotts=TimeSeriesSubtract@@ascMaxMin,{DayRange[{2019,1,1},{2019,12,31}]},MovingAverage[ts,],FrameTrue,FrameLabel{"Daily Temperature Difference (Max-Min), in °F","ΔT(°F)"},PlotLabel"Daily Temperature Difference during 2019, Los Angeles, CA",PlotStyle{Opacity[.6],Black}
Out[]=
Exploring the data
Exploring the data
Return the head of max
In[]:=
Head/@max//Tally
Out[]=
{{List,100}}
Return units:
In[]:=
max//Flatten//QuantityUnit//Tally
Out[]=
{{DegreesFahrenheit,36367},{QuantityUnit[Missing[NotAvailable]],133}}
Put all max values in a temporal data after treating missing points:
In[]:=
tdMAX=TemporalData[TimeSeries[#,MissingDataMethodAutomatic]&/@max];
Put all min values in a temporal data after treating missing points:
In[]:=
tdMIN=TemporalData[TimeSeries[#,MissingDataMethodAutomatic]&/@min];
Calculate the difference (max-min), then make an association as city->difference, and sort the data by the median value of differences over a year:
In[]:=
diff=AssociationThread[cities,(tdMAX-tdMIN)["ValueList"]]//SortBy[Median];
Visualize the max recorded difference in 2019:
In[]:=
BarChartasMax=Sort[Max/@diff],ChartStyle"DarkRainbow",ChartLabelsPlacedRotate[#,90Degree]&/@EntityValueKeys[asMax],EntityFunctioni,Ifi===,Stylei["Name"]<>"("<>i<>")",Red,i["Name"]<>"("<>i<>")",Red,Axis,ImageSizeFull,AspectRatio14,GridLinesAutomatic,PlotLabel"Max Temperaure Difference Recorded on 2019"
Out[]=
Visualize the number of days in 2019 with the temperature difference of 30°F or more (highlight LA):
In[]:=
BarChartasDays=SortLengthSelectNormal@#,#>&&/@diff,ChartStyle"DarkRainbow",ChartLabelsPlacedRotate[#,90Degree]&/@EntityValueKeys[diff],EntityFunctioni,Ifi===,Stylei["Name"]<>"("<>i<>")",Red,i["Name"]<>"("<>i<>")",Red,Axis,ImageSizeFull,AspectRatio14,GridLinesAutomatic,PlotLabel"Number of days with the temperaure difference of 30°F or more during 2019"
Out[]=
Distribution of data
Distribution of data
Visualize a smooth histogram of the temperature differences for Los Angeles, CA:
Make a distribution chart for 3 random cities using the temperature differences during 2019:
Make a box-whisker chart using the temperature differences during 2019:
Well, I wonder if the position of LA LA land among top US cities (in terms of its weather) was the main reason that Iranians pick it as their most-wanted destination?! Very likely, yes.