ABSTRACT (original article): Ecosystems are commonly organized into trophic levels -- organisms that occupy the same level in a food chain (e.g., plants, herbivores, carnivores). A fundamental question in theoretical ecology is how the interplay between trophic structure, diversity, and competition shapes the properties of ecosystems. To address this problem, we analyze a generalized Consumer Resource Model with three trophic levels using the zero-temperature cavity method and numerical simulations. We find that intra-trophic diversity gives rise to “emergent competition’’ between species within a trophic level due to feedbacks mediated by other trophic levels. This emergent competition gives rise to a crossover from a regime of top-down control (populations are limited by predators) to a regime of bottom-up control (populations are limited by primary producers) and is captured by a simple order parameter related to the ratio of surviving species in different trophic levels. We show that our theoretical results agree with empirical observations, suggesting that the theoretical approach outlined here can be used to understand complex ecosystems with multiple trophic levels. CITATION (original article): Feng Z, Marsland R III, Rocks JW, Mehta P (2024), Emergent competition shapes top-down versus bottom-up control in multi-trophic ecosystems. PLOS Computational Biology 20(2): e1011675. https://doi.org/10.1371/journal.pcbi.1011675
Introduction
Introduction
ODE model for ecological dynamics
ODE model for ecological dynamics
In the paper, we proposed a set of coupled ODE equations for the consumer-resource dynamics of a 3-trophic-level ecosystems.
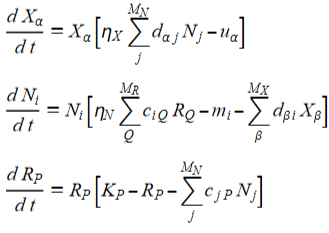
where is a matrix of consumer preferences for the the primary consumers and is a matrix of consumer preferences for the secondary consumers, and ,∈[0,1] account for finite efficiency of biomass conversion. When and are close to one, energy is very efficiently transferred across trophic levels. In contrast, when these values are close to zero, energy cannot be efficiently harvested from lower trophic levels. We also define the carrying capacity for each primary producer , along with the death rates for each primary consumer and for each secondary consumer. In this notebook, we consider the case where the consumer preferences are drawn independently and identically with mean / and standard deviation . We parameterize the variation in in terms of the random variables so that +,,.Similarly, we draw the consumer preferences independently and identically with mean / and standard deviation , parameterized in terms of the random variables , +,.For convenience, we choose to scale the means and variances of the consumer preferences with the number of species, or . We note that this does not affect the generality of our results, but greatly simplifies the mathematical treatment in the thermodynamic limit.
c
iQ
M
N
M
R
M
N
d
βi
M
X
M
N
M
X
η
X
η
N
η
X
η
N
Κ
P
P
m
i
i
u
α
d
ia
μ
d
M
N
σ
d
M
N
d
ia
γ
id
d
αi
μ
d
M
N
σ
d
γ
αi
<>0
γ
αi
<>
γ
αi
γ
βj
δ
αβ
δ
ij
M
N
c
iA
μ
c
M
R
σ
c
M
R
ϵ
jP
c
iP
μ
c
M
R
σ
c
ϵ
iP
<>0,
ϵ
iP
ϵ
iP
ϵ
jQ
δ
ij
δ
PQ
M
R
1/
M
N
1/
M
R
Example of dynamics
Example of dynamics
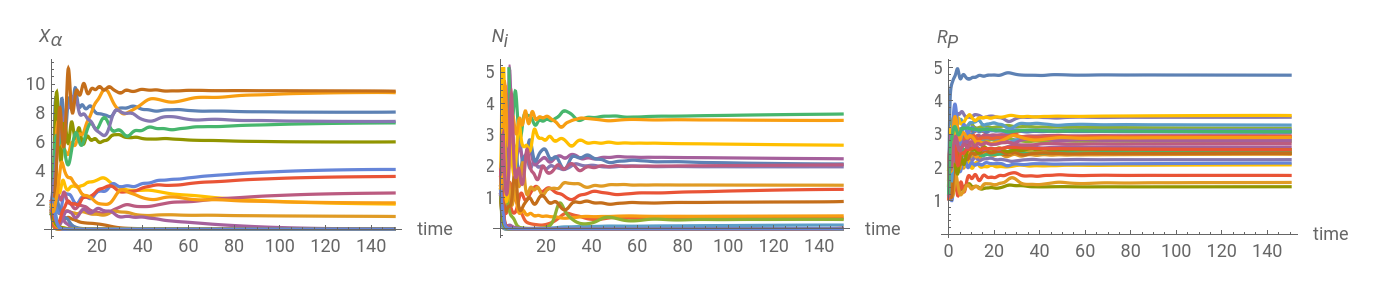
Here we choose a specific set of model parameters, define the numerical,plot one example of the dynamics. Each line represent the biomass of one species in each trophic levels.
Define function for ODE simulation
FullSimulate[topspecies_,r1_,r2_,k_,m_,u_,sigmak_,sigmam_,sigmau_,muc_,mud_,sigmac_,sigmad_,tfinal_]:=Module[{},middlespecies=Round[topspecies/r1];resources=Round[topspecies/r1/r2];iniX=RandomReal[{1,2},{topspecies}];inin=RandomReal[{1,2},{middlespecies}];iniR=RandomReal[{1,2},{resources}];Dm=RandomVariate[NormalDistribution[mud/middlespecies,sigmad/Sqrt[middlespecies]],{topspecies,middlespecies}];Cm=RandomVariate[NormalDistribution[muc/resources,sigmac/Sqrt[resources]],{middlespecies,resources}];us=RandomVariate[NormalDistribution[u,sigmau],topspecies];ms=RandomVariate[NormalDistribution[m,sigmam],middlespecies];ks=RandomVariate[NormalDistribution[k,sigmak],resources];eqns={X'[t]X[t](Dm.n[t]-us),n'[t]n[t](Cm.R[t]-ms-Transpose[Dm].X[t]),R'[t]R[t](ks-R[t]-Transpose[Cm].n[t]),X[0]==iniX,n[0]==inin,R[0]==iniR};solution=NDSolve[eqns,{X,n,R},{t,tfinal},Method"StiffnessSwitching"][[1]];AllR=Table[Evaluate[R[t]/.solution],{t,0,tfinal,0.1}];Alln=Table[Evaluate[n[t]/.solution],{t,0,tfinal,0.1}];AllX=Table[Evaluate[X[t]/.solution],{t,0,tfinal,0.1}];{AllR,Alln,AllX}];
Specify parameters for ODE simulation and make a plot of dynamics
Endtime=150;topspecies=30;sigmau=0.1;sigmam=0.1;sigmak=0.1;u=1;m=1;k=4;sigmac=0.5;muc=1;sigmad=0.5;mud=1;r1=1;r2=1;Dynamics=FullSimulate[topspecies,r1,r2,k,m,u,sigmak,sigmam,sigmau,muc,mud,sigmac,sigmad,Endtime];Rdynamics=Table[Dynamics[[1,All,alpha]],{alpha,1,Length[Dynamics[[1,1,All]]]}];Ndynamics=Table[Dynamics[[2,All,alpha]],{alpha,2,Length[Dynamics[[1,2,All]]]}];Xdynamics=Table[Dynamics[[3,All,alpha]],{alpha,3,Length[Dynamics[[1,3,All]]]}];Show[GraphicsRow[{ListLinePlot[Xdynamics,AxesLabel{"time",""},DataRange->{0,Endtime},AspectRatio->0.5],ListLinePlot[Ndynamics,AxesLabel{"time",""},DataRange->{0,Endtime},AspectRatio->0.5],ListLinePlot[Rdynamics,AxesLabel{"time",""},DataRange->{0,Endtime},AspectRatio->0.5]}],ImageSize->Full]
X
α
N
i
R
P
Out[]=
Compare cavity method prediction and simulation
Compare cavity method prediction and simulation
Self-consistency equations from cavity method
Self-consistency equations from cavity method
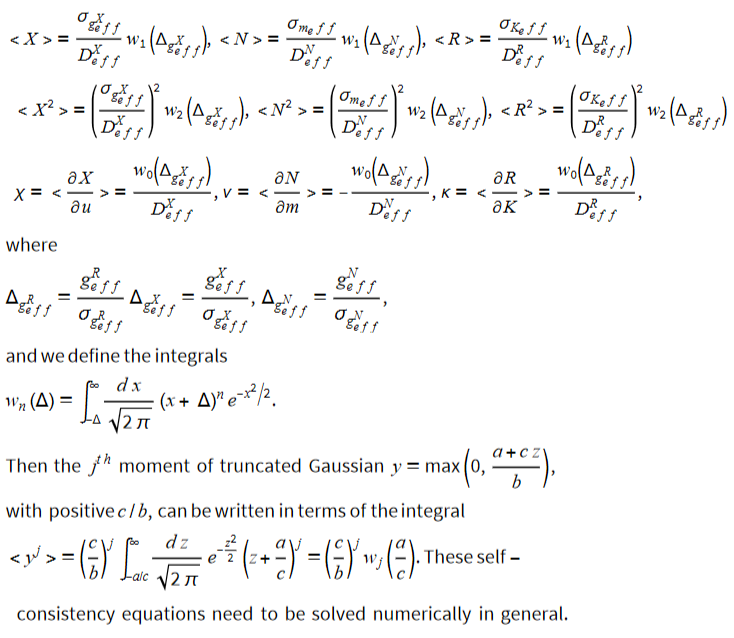
Thestatisticsofsteadystatesofthemodeldefinedintheprevioussectioncanbecalculatedusingcavitymethod.Theresultisasetofself-consistencyequationswith9equationsfor9variables,
Define functions for Gaussian integrals
Define functions for Gaussian integrals
Here we define the integrals for the 0, 1 and 2nd moment of truncated Gaussians as functions. We directly use the result from Integration in terms of error function speed up the code.
In[]:=
w1[d_]:=+d1+Erfw0[d_]:=1+ErfW[d_]:=+d1+Erf+(1+)1+Erf
-
2
d
2
π
2
d
2
2π
1
2
d
2
2
-
2
d
2
π
2
d
2
2π
d-
2
d
2
2
d
π
2
d
2
Define cavity solver
Define cavity solver
We define the solver “Wholesolve” for self consistency equations from cavity method.
Plot the distribution of biomass from repeated simulations, and compare to cavity result
Plot the distribution of biomass from repeated simulations, and compare to cavity result
Plotting phase diagrams from cavity predictions
Plotting phase diagrams from cavity predictions
Evaluate cavity solution for a range of parameters and save the result
Evaluate cavity solution for a range of parameters and save the result
Here we set the range of parameters, evaluate the cavity equations in the range, and save them.
Get the effective competition and order parameters from the solutions
Get the effective competition and order parameters from the solutions
Making the plots
Making the plots
CITE THIS NOTEBOOK
CITE THIS NOTEBOOK
Emergent competition shapes top-down versus bottom-up control in multi-trophic ecosystems
by Zhijie Feng, Robert Marsland III, Jason W. Rocks & Pankaj Mehta
Wolfram Community, STAFF PICKS, March 20, 2024
https://community.wolfram.com/groups/-/m/t/3144764
by Zhijie Feng, Robert Marsland III, Jason W. Rocks & Pankaj Mehta
Wolfram Community, STAFF PICKS, March 20, 2024
https://community.wolfram.com/groups/-/m/t/3144764