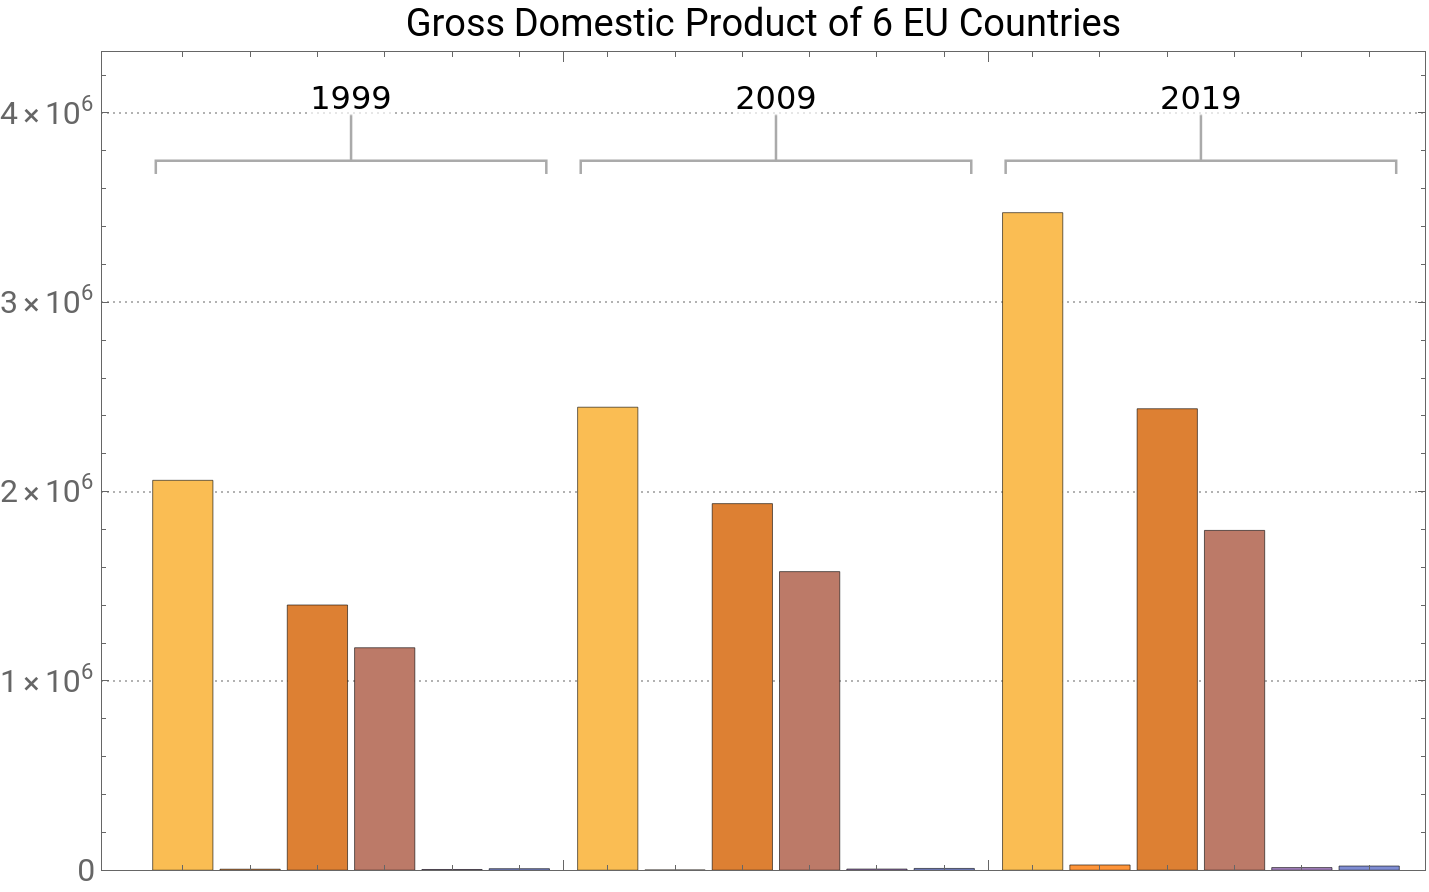
alist1999={2059480,5407,1400999,1175150,3861,8148}BarChart[alist1999]
Out[]=
{2059480,5407,1400999,1175150,3861,8148}
Out[]=
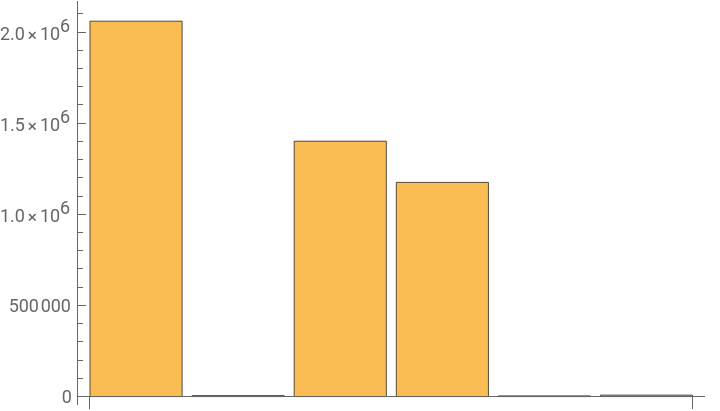
blist2009={2445730,1432,1936422,1577256,6260,9419}
BarChart[blist2009]
Out[]=
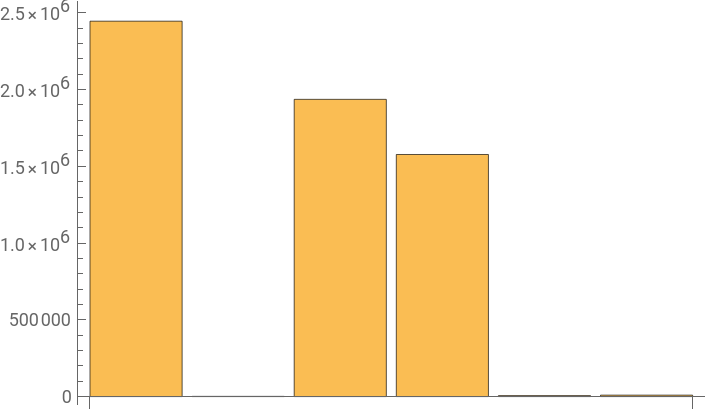
clist2019={3473350,27732,2437635,1794935,14048,22201}BarChart[clist2019]
Out[]=
{3473350,27732,2437635,1794935,14048,22201}
Out[]=
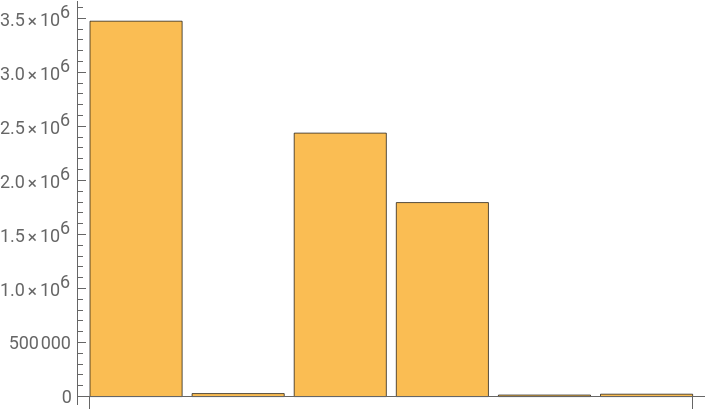
BarChart3D[{alist1999,blist2009,clist2019}]
Out[]=

BarChart[{alist1999,blist2009,clist2019},ChartLabels->{Callout[{"1999","2009","2019"}],None},LabelStyle->16,PlotTheme->"Detailed",PlotLabel->Style["Gross Domestic Product of 6 EU Countries",Black],ImageSize->600,ChartLegends{"Germany","Estonia","France","Malta","Iceland"}]
Out[]=