Development:
2
x
2
y
2
(x-a)
2
y
2
x
2
y
2
(x-a)
2
y
Raising both members squared and developing remains:
2ax--=2r+
2
r
2
a
2
(x-a)
2
y
Let a = 6 and r = 2, then:
12x-40=4+;3x-10=+;
2
(x-6)
2
y
2
(x-6)
2
y
Raising both members squared and developing remains:
64-48x+8-=0;
2
x
2
y
In[]:=
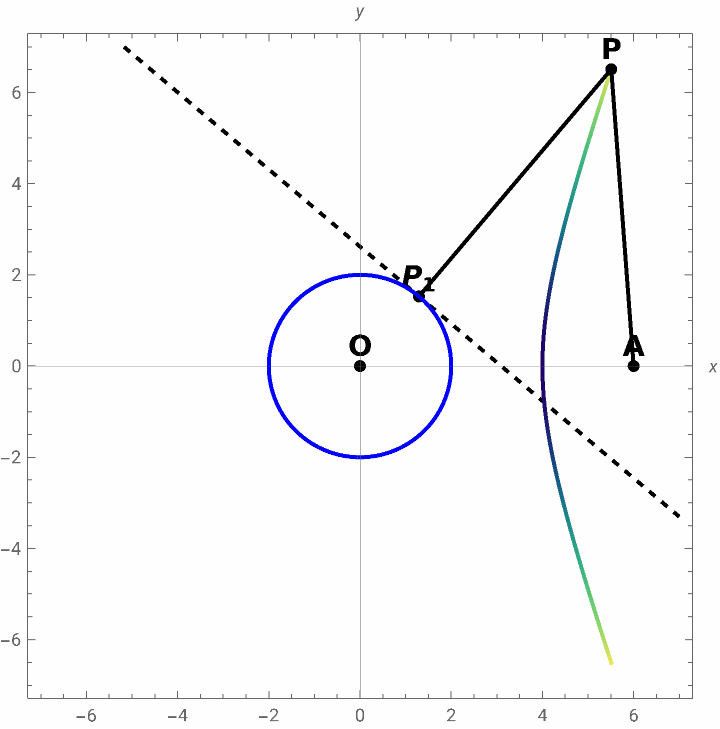
Manipulater=2;P[t_]:=Cosh[t]+3,2+,;O1={0,0};A1={6,0};d1=Norm[P[x1]-P1[x1]];d2=Norm[P[x1]-A1];t=Grid[{{,},{N[d1],N[d2]}},FrameAll,ItemStyle->15,ItemSize15];ShowContourPloty-==-x-2+,{x,-7,7},{y,-7,7},ContourStyle{Black,Dashed},ParametricPlotP[x],x,-,x1,ColorFunction->"BlueGreenYellow",Graphics[{Black,PointSize[0.018],Point[O1],Text[Style["O",14,Bold],O1,{0,-1.2}],Point[P[x1]],Text[Style["P",14,Bold],P[x1],{0,-1.2}],Point[P1[x1]],Text[Style["",14,Bold],P1[x1],{0,-1.2}],Point[A1],Text[Style["A",14,Bold],A1,{0,-1.2}],Thick,Line[{P[x1],A1}],Line[{P[x1],P1[x1]}],Blue,Thick,Circle[O1,r]}],AspectRatioAutomatic,AxesTrue,AxesOrigin{0,0},AxesLabel{x,y},PlotRange7,Style["Right branch of a hyperbola",Bold,Large],x1,-+0.00002,"Value ()",-+0.000001,,0.00001,Delimiter,{{t,3,"Distance from point P to circumference () and from point P to point A "}},ControlPlacementTop
2
Sinh[t];P1[t_]:=23
9+6Cosh[t]++8
2
Cosh[t]
2
Sinh[t]
Cosh[t]
9+6Cosh[t]++8
2
Cosh[t]
2
Sinh[t]
4
2
Sinh[t]9+6Cosh[t]++8
2
Cosh[t]
2
Sinh[t]
PP
1
PA
4
2
Sinh[x1]9+6Cosh[x1]++8
2
Cosh[x1]
2
Sinh[x1]
Cosh[x1]+3
2
2
Sinh[x1]3
9+6Cosh[x1]++8
2
Cosh[x1]
2
Sinh[x1]
Cosh[x1]
9+6Cosh[x1]++8
2
Cosh[x1]
2
Sinh[x1]
π
2
P
1
π
2
x
1
π
2
π
2
P
1
Out[]=