Introduction
Introduction
A country’s coastline has no well-defined length, as its length depends on the length of the ruler used to estimate it. A shorter ruler allows for more accuracy in measuring complex, irregular coastlines; thus, as the ruler length decreases, the coastline length becomes theoretically infinite. This is known as the “Coastline Paradox”, which can be attributed to the fractal-like property of coastlines. A coastline’s fractal dimension provides a quantitative index of complexity, measuring how fast the estimated coastline length increases with respect to a smaller and smaller scale at which it is measured. In this project, I used various box-counting methods to measure and compare the fractal dimensions of coastlines.
Generating a Coastline Box Map
Generating a Coastline Box Map
Box-counting is a common method used to determine a fractal dimension. To use this method on coastlines, it involves drawing a grid of boxes over the country region and counting how many boxes are required to cover the coastline. The fractal dimension is then calculated by seeing how this number changes as the box size becomes smaller. For a given coastline, I generated a map to visualize the process of lining a coast with boxes.
Using CountryData, I first got a list of coastline coordinates for the main landmass of the United Kingdom. I also specified a Balthasart map projection that preserves area - CountryData defaults to using an equirectangular projection.
Extracting coastline coordinates:
In[]:=
coastlinepoints=LastSortCountryData,{"Shape",{"CylindricalEqualArea",50}}[[1,3,1]];
Next, I turned the country’s shape into a region using DiscretizeGraphics, which allowed me to use RegionBounds to find the coordinates of the coastline’s lower, upper, left and right boundary.
Detecting coastline boundaries:
In[]:=
coastlineregion=DiscretizeGraphics[Line[coastlinepoints]];
In[]:=
coastlineboundaries=RegionBounds[coastlineregion];
After determining the coastline’s boundaries, I placed a grid of boxes over the country region. I determined box length by dividing the longer side (either width or height) of the country into n segments. Here, I used n=12.
Drawing a grid:
In[]:=
boxlength=Max[Differences/@coastlineboundaries]/12;boxes=Flatten[Table[Rectangle[{x-boxlength/2,y-boxlength/2},{x+boxlength/2,y+boxlength/2}],{x,coastlineboundaries[[1,1]]-boxlength,coastlineboundaries[[1,2]]+boxlength,boxlength},{y,coastlineboundaries[[2,1]]-boxlength,coastlineboundaries[[2,2]]+boxlength,boxlength}]];
Out[]=
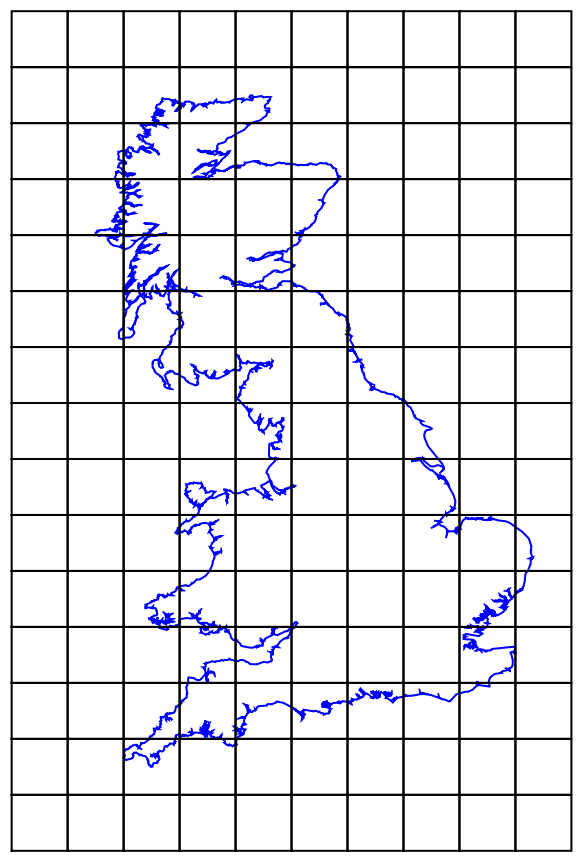
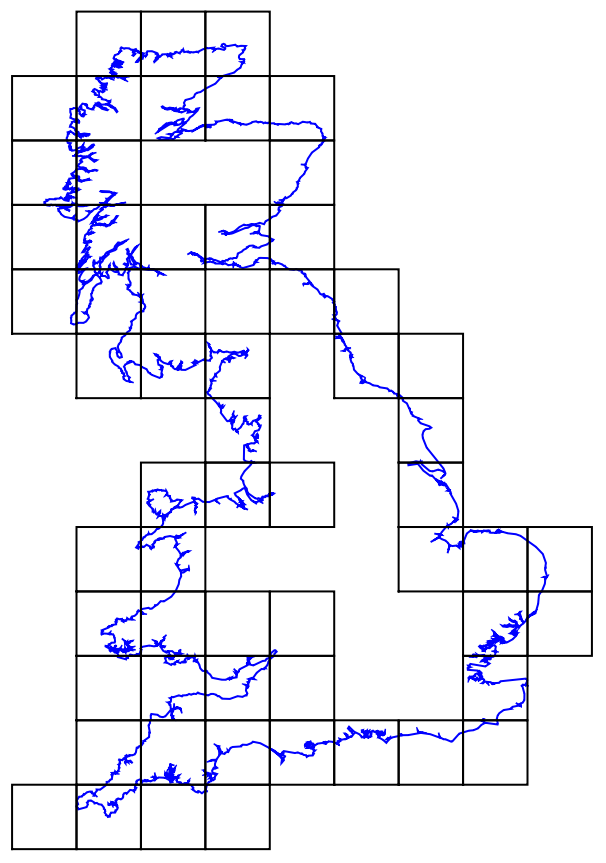
Then, using RegionDisjoint, I selected boxes that contain any part of the coastline:
Select[boxes,!RegionDisjoint[coastlineregion,#]&];
Out[]=
Putting it Together
Putting it Together
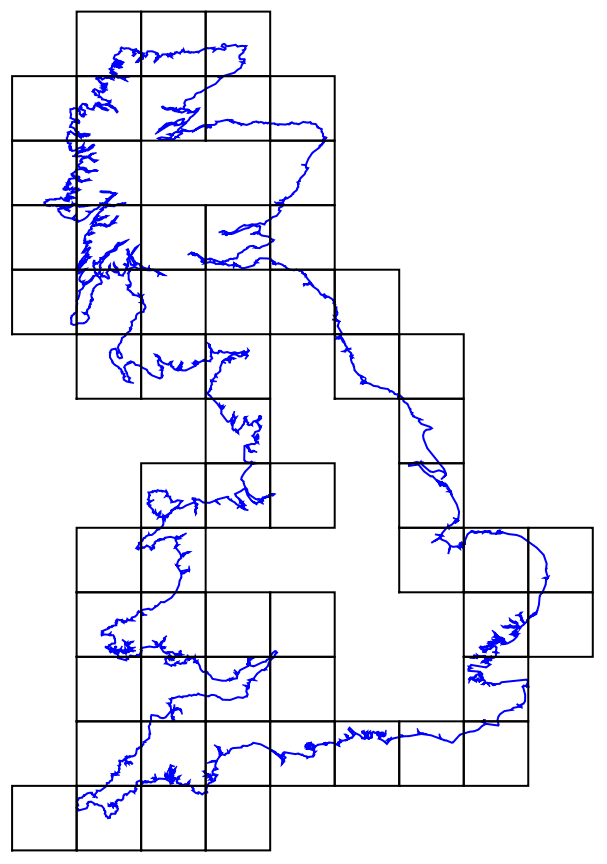
Combining all the steps above, this function, given a country and an integer n, outputs a coastline box map as well as Log[1/s] and Log[N(s)], where s is box length and N(s) is the number of boxes of size s that it takes to line the coast. This data is necessary to calculate fractal dimensions later on.
Generating a coastline box map:
In[]:=
CoastlineBoxMap[country_,n_Integer]:=Module[{coastlinepoints,coastlineregion,coastlineboundaries,boxlength,coastlineboxes},coastlinepoints=Last[Sort[CountryData[country,{"Shape",{"CylindricalEqualArea",50}}][[1,3,1]]]];coastlineregion=DiscretizeGraphics[Line[coastlinepoints]];coastlineboundaries=RegionBounds@coastlineregion;boxlength=Max[Differences/@coastlineboundaries]/n;coastlineboxes=Flatten[Table[Rectangle[{x-boxlength/2,y-boxlength/2},{x+boxlength/2,y+boxlength/2}],{x,coastlineboundaries[[1,1]]-boxlength,coastlineboundaries[[1,2]]+boxlength,boxlength},{y,coastlineboundaries[[2,1]]-boxlength,coastlineboundaries[[2,2]]+boxlength,boxlength}]];{Graphics[{{FaceForm[],EdgeForm[Blue],Polygon[coastlinepoints]},{FaceForm[],EdgeForm[Black],Select[coastlineboxes,!RegionDisjoint[coastlineregion,#]&]}}],{Log[1/boxlength],Log[Length[Select[coastlineboxes,!RegionDisjoint[coastlineregion,#]&]]]}}]
In[]:=
CoastlineBoxMap,12
Out[]=
,{4.46642,Log[59]}
Calculating Fractal Dimensions
Calculating Fractal Dimensions
A fractal dimension using the box-counting method is defined as:
s0
To calculate coastline fractal dimensions, I did a linear fit of Log[1/s] vs. Log[N(s)] using five successively smaller values of s. The slope of the linear fit line gives the coastline’s fractal dimension.
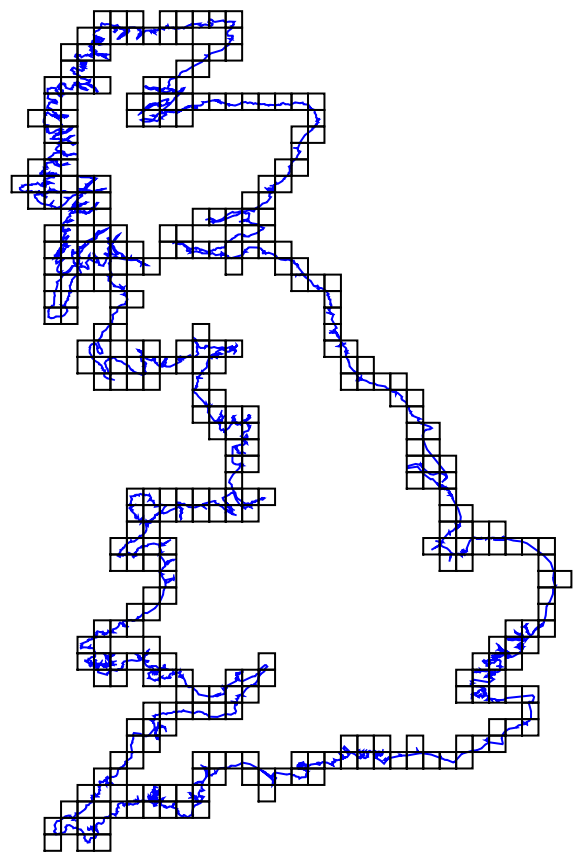
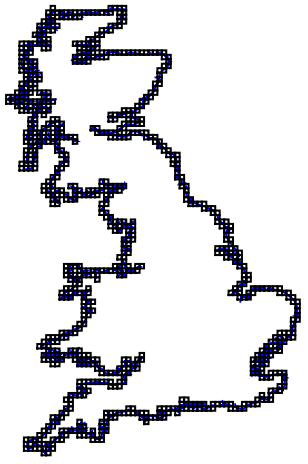
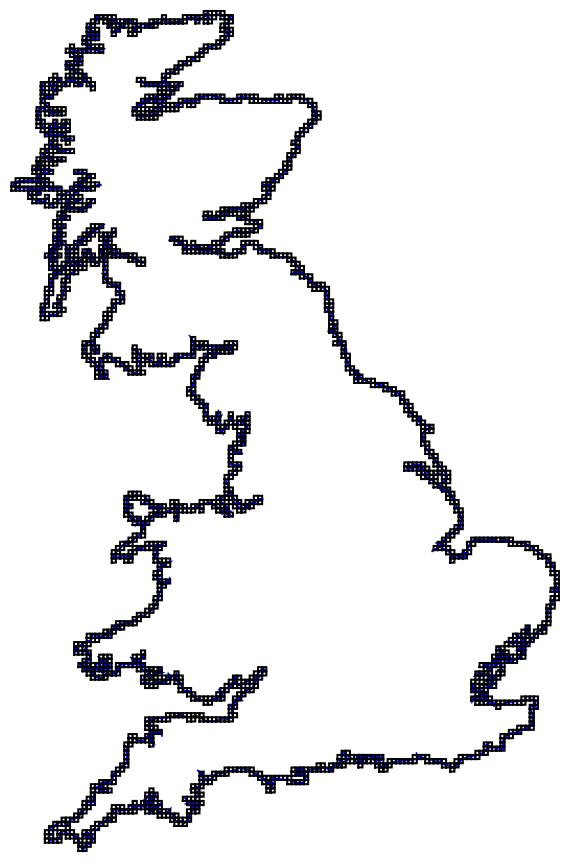
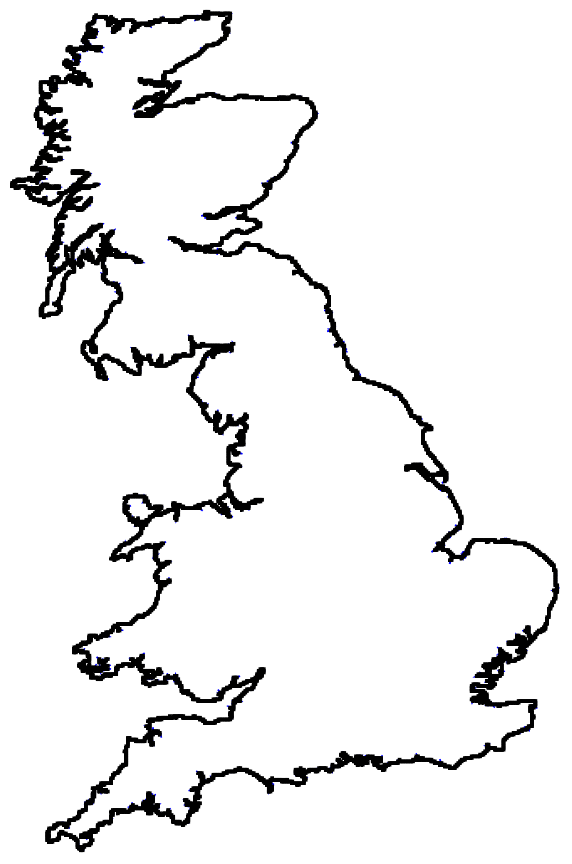
First, I generated 5 different coastline box maps by dividing the longer side of the country into 10, 50, 100, 200, 500 squares:
In[]:=
ukcoast=CoastlineBoxMap,#&/@{10,50,100,200,500}
Out[]=
,{4.2841,Log[50]},
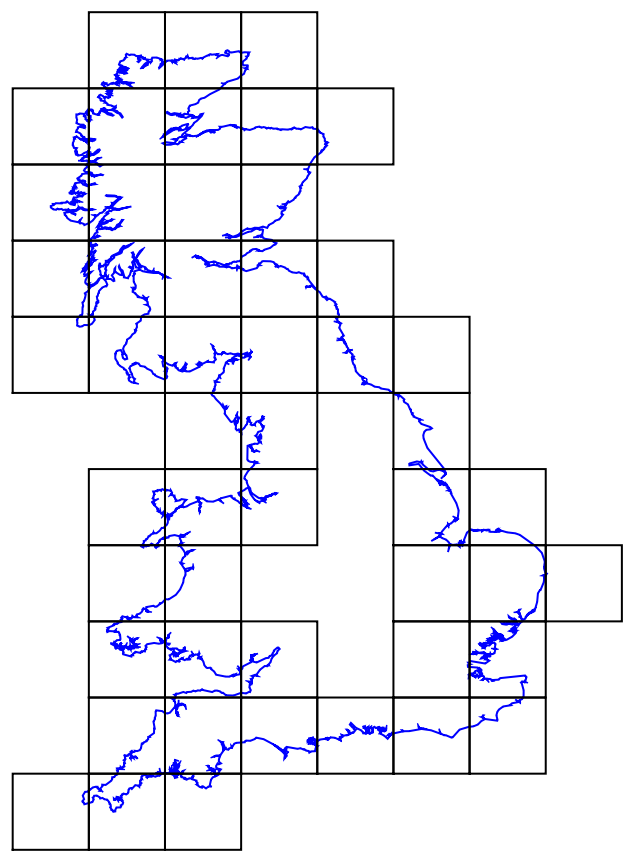
,{5.89354,Log[371]},
,{6.58668,Log[879]},
,{7.27983,Log[1993]},
,{8.19612,Log[5742]}
After doing a linear fit of the data, I found the fractal dimensions by extracting the slope from the linear fit equation. The following function takes in any country and outputs the fractal dimension of its coastline:
Isolating the Coastline
Isolating the Coastline
Since the UK is an island, its entire border is a coastline, so my fractal dimension calculation worked well. However, for countries that are not islands, my CountryFractalDimension function would take the fractal dimension of the country's entire border rather than just its coastline. I decided to write an algorithm to distinguish between parts of a border that are coastlines and parts of a border that are shared with neighboring countries.
The following function takes a country's border, deletes sections that are shared with neighboring countries, and ultimately outputs coordinates of its coastline (if any):
For example, here is Norway's entire border:
Using my CoastlinePointsOnly function, I extracted Norway's coastline:
One issue with extracting coastline coordinates is that many countries have multiple coastlines. To make the country compatible with my box-counting method, I could only perform the fractal dimension calculation on one coastline. The following function finds the two largest GeoDistances greater than 3 kilometers between successive points along the full coastline border, deletes the points in between those distances, and repeats this process until there are no longer two GeoDistances greater than 3 kilometers, indicating that we are left with one coastline.
Getting a country's longest coastline:
To visualize the above functions, here is Russia's complete border, then its coastlines, and finally, its longest coastline:
After isolating the coastlines, we can calculate coastline fractal dimensions of countries to a higher degree of accuracy.
Results
Results
Before testing out my fractal dimension function on other countries, I had to modify my CoastlineBoxMap and CountryFractalDimension functions to perform the calculations on the longest coastline only.
Updated coastline box map and fractal dimension functions:
This updated CountryFractalDimension function takes in a country and outputs a more accurate coastline fractal dimension. Besides the United Kingdom, I chose to take a closer look at Norway, Japan, and Russia. Here are their coastline box maps and fractal dimensions (fractal dimension data for every country can be found in the next section):
Conclusion
Conclusion
Below is a table of all countries, dependencies, and territories ranked by their coastline fractal dimension. If the region is landlocked, its fractal dimension is zero.
From my fractal dimension data, we can quantitatively conclude that Guinea-Bissau has the most complex coastline. Check it out:
See the attached notebook for an interactive visualization of my fractal dimension data!
Future Directions
Future Directions
There are a few anomalies and inaccuracies in my fractal dimension data due to having to limit my calculation to the longest coastline only. In the future, I hope to modify my algorithm so that all coastlines can be accounted for when measuring fractal dimensions. Additionally, I could write an algorithm to perform similar fractal dimension calculations using a ruler method instead of a box-counting method and compare the data.
Acknowledgements
Acknowledgements
Thank you to my amazing mentor Stephen Schroeder for helping and supporting me throughout the process! I would also like to thank my mentor group and the rest of the students, mentors, and staff for a wonderful experience at Wolfram Summer Camp.