In[]:=
(*Thebackgroundfunction:*)Vel[x_,z_]:=2000.+x/Sqrt[2.]+z/Sqrt[2.]
In[]:=
(*Positionsof"measurements"andtheirvalues:*)Xi=Subdivide[-900,900,99]+RandomVariate[NormalDistribution[0,10],100];Zi=900+Xi/10+RandomVariate[NormalDistribution[0,10],100];Fi=RandomReal[{0,1},100];
In[]:=
(*Listofcolorsforthe"measurements":*)plotstyles=Map[ColorData[{"CherryTones","Reverse"}],Fi];
In[]:=
(*Thebackgroundfunction'sdensityplot:*)velplot=DensityPlot[Vel[xi,zi],{xi,-1000,1000},{zi,-300,1500},ColorFunction->"BlueGreenYellow",ScalingFunctions->{Automatic,"Reverse"},PlotLegends->Placed[BarLegend[Automatic,LegendLabel->Placed["Velocity (m / s)",Below],LegendLayout->"Row"],Below],PlotRange->All];(*"Measurements"visualization:*)pointsplot=ListPlot[List/@Thread[{Xi,Zi}],ScalingFunctions->{Automatic,"Reverse"},PlotStyle->plotstyles];
In[]:=
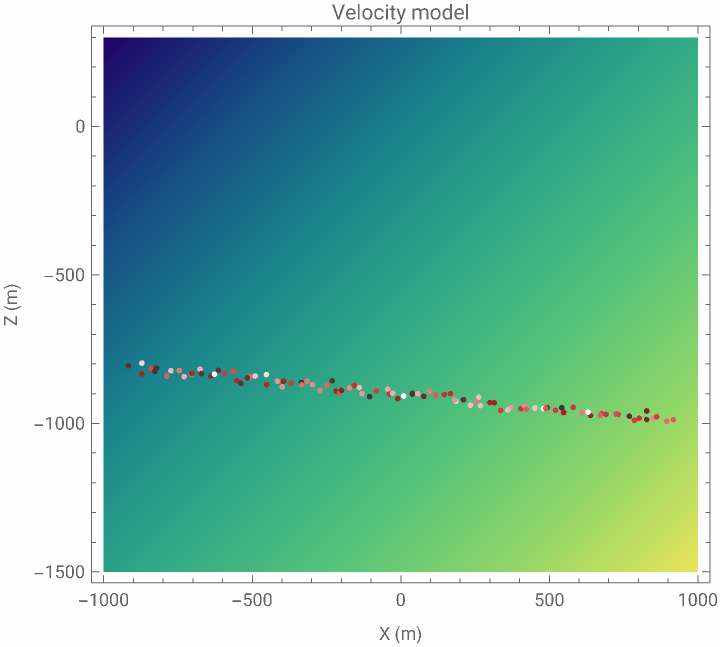
(*Showitall:*)Show[velplot,pointsplot,PlotLegends->Automatic,AspectRatio->Automatic,PlotLabel->"Velocity model",FrameTicks->True,FrameLabel->{"X (m)","Z (m)"}]
Out[]=
|