The Wolfram Emerging Leaders Program: High School (WELP:HS) is a remote, semester-long program designed for exceptional graduates from the Wolfram High School Summer Research Program to continue to develop their skills. Students work in a small group over the course of a semester to do either a research-based project or a product development–based project under the guidance of expert mentors. Projects are centered around a topic at the intersection of the group’s interests.
This essay was written by:
This essay was written by:
This project analyzes oil spillage using von Neumann neighborhoods and search functions. In order to improve the von Neumann function we created a 2m+1 by 2m+1 grid, m being the horizontal distance from the origin to the edge of the grid, using PadRight to fill the grid with 0's. The second idea we had for modeling an oil spill was to create a search model which would start off with an final 2D rule we want to achieve and a initial 2D Cellular Automata rule. This code uses rule 30, and runs it with a 40% chance of mutating. These mutations generate images that represent the progression of an oil spill, and further represent any uncertainties or behavior changes in an oil spill. In summary, the code explores the behavior of mutated rules derived from Cellular Automaton rule 30, providing insights into the impact of rule mutations on the automaton's evolution. By using a combination of techniques, our project models the diffusion of an oil spill on the surface of water.
Introduction
Introduction
“All processes, whether they are produced by human effort or occur spontaneously in nature, can be viewed as computations… The evolution of a system is a computation.”- Stephen Wolfram
Stephen Wolfram pioneered the notion of a computational universe. The idea that matter is composed of elements, and that structures of matter are defined by relations between elements, are all applications of computations. While certain computations can be modeled with mathematical formulas, such as gravity, other computations remain abstract deviations.
Using the Wolfram Language, we modeled the trajectory of oil spills using cellular automata. An automaton is best described as a self operating machine that pertains to a set of rules. In a cellular automata, depending on the starting cell, there is a set of rules for what kind of cell comes after it in an x by x grid. As the following cells change color in accordance to its neighboring cell, there begins to be organized patterns and designs. These patterns are used to simply create pictures or to simulate the behavior of phenomena in nature. According to the notion of a computational universe, all processes can be boiled down to computations, including oil spills. Oils are predominantly composed of two atoms: hydrogen (H) and carbon (C). Molecular compounds composed exclusively of these two elements are hydrocarbons. When oil spills occur, they create polycyclic aromatic hydrocarbons (PAHs). PAHs are known for their toxicity, carcinogenicity, environmental persistence, and bioaccumulation.
One general drawback of cellular automata regarding its ability to mimic real world scenarios is its lack of accuracy due to an inability to obtain complete data. In our project, while modeling the spread of oil spills was doable, incorporating other factors such as wind, foreign objects, animals, and human activity was difficult. Because they are so unpredictable, we would need extensive knowledge on the systems and modeling this into cellular automata would require advanced mathematical formulas.
Another way we attempted to model an oil spill was to create a mutate and search algorithm that starts off by picking a random rule, then randomly mutate that rule several times, storing each mutation in a list. After that the function would iterate through the list to determine which rule to closely matches the 2D oil spill grid retrieved from a oil spill model created by the National Oceanic Atmospheric Administration online. Then the closest matching rule would be randomly mutated creating variations of that rule that would match even closer to the final 2d oil spill grid.
Cellular Automata Model
Cellular Automata Model
von Neumann Neighborhood
von Neumann Neighborhood
A simple method of modeling the spread of oil over time is to use a von Neumann neighborhood. A von Neumann neighborhood is defined as the area consisting of a central cell and its four adjacent cells horizontally and vertically. Given any point (x,y) and a central point(x0, y0), a given range, r , of the von Neumann neighborhood can be defined such that the sum of the absolute value of the difference between the x coordinates and the difference between the y coordinates is less than or equal to that range.

We can create a function that takes in a radius and the grid boundaries that uses a table to get to every point in the grid while checking if the sum of the absolute values of the x and y coordinates are equal to less than or greater than the radius. If the sum is equal to or less than then the function will change it to 1 but if the sum is greater than the radius then it will leave the cell as 0. We then ran a table through the function that increased the radius by 1 after each iteration and also we used ArrayPlot to turn the 2D array into a 2D array of squares, with each square being an element in the 2D array.
In[]:=
vonNeumannNeighborhood[r_,m_]:=Table[If[Abs[x]+Abs[y]==r,1,If[Abs[x]+Abs[y]<r,1,0]],{x,-m,m},{y,-m,m}]GraphicsGrid[Partition[Table[ArrayPlot[vonNeumannNeighborhood[n,4],MeshTrue,PlotLabelrn],{n,0,3}],2],ImageSize300]
Out[]=
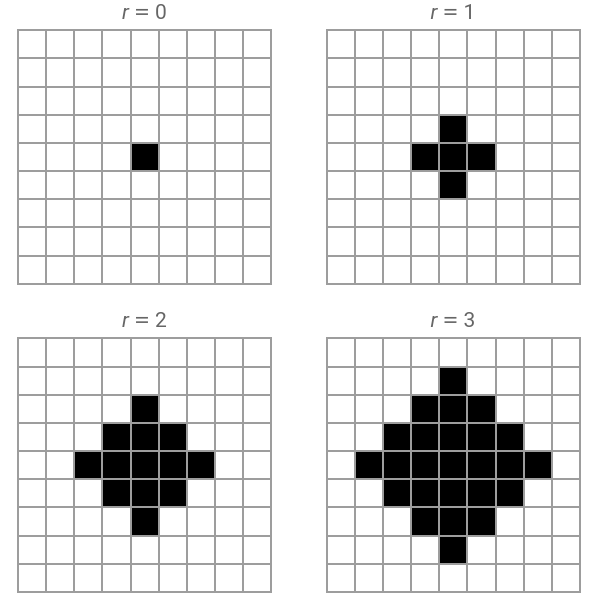
This is the most simplistic model of an oil spill that doesn't take into account that oil disperses over time so the amount of oil dispersed should decrease for cells as the oil moves further away from the origin.
Improved von Neumann function
Improved von Neumann function
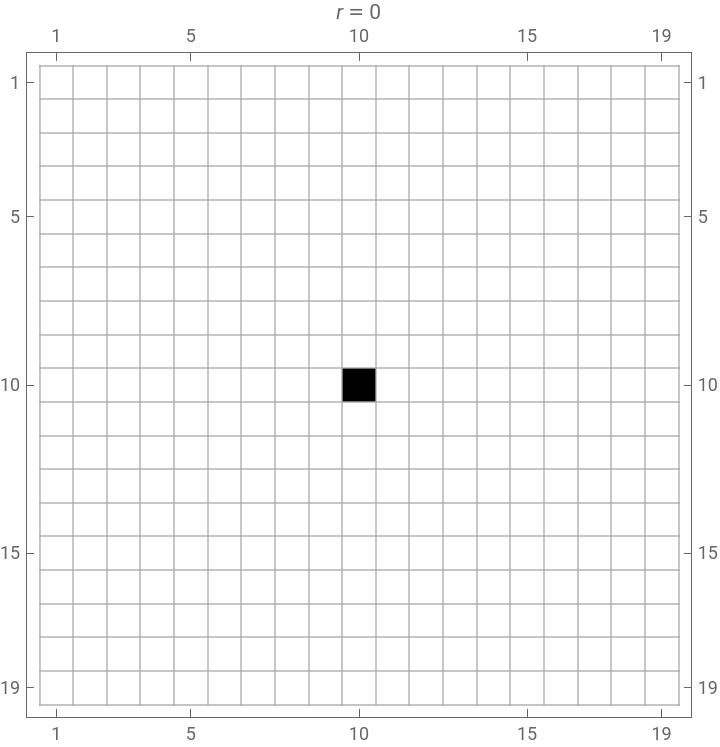
In order to improve the von Neumann function we created a 2m+1 by 2m+1 grid, m being the horizontal distance from the origin to the edge of the grid, using PadRight to fill the grid with 0's. Then instead of passing in the dimensions of the grid as a parameter, we passed in the grid itself so that when running a table through the coordinates, we would check if the sum of the absolute values between the x and y coordinate is less than the radius, greater than the radius or equal to the radius. If the distance is less than the radius then the function would not change that cell's value, if the distance is equal to radius then it uses GreyLevel to color in the cell by the float value of the current radius divided by 10, and if it is greater than the radius then the function changes the value of the cell to 0.
In[]:=
m=9;grid=PadRight[{{}},{2m+1,2m+1}];oilspill[r_,oldgrid_]:= Table If Abs[x]+Abs[y]==r,GrayLevel[r/10], If Abs[x]+Abs[y]>r,0, grid[[x+m+1,y+m+1]] , {x,-m,m,1},{y,-m,m,1} ;Manipulate[ArrayPlot[grid=oilspill[n,grid],Mesh->True,PlotLabel->r==n,Frame->True,FrameTicks->All],{n,0,m,1},SaveDefinitions->True]
Out[]=


Search and Mutate Algorithm Model
Search and Mutate Algorithm Model
The second idea we had for modeling an oil spill was to create a search model which would start off with an final 2D rule we want to achieve and a initial 2D Cellular Automata rule. We would create a mutate function that would take in the initial rule and mutate that rule several times by flipping the rule element, 1 to 0 and 0 to 1, given a certain probability and store those rules in an array. Then we would create a search algorithm that would iterate through the array and find the mutated rule that behaved similarly to the final rule. Then it would pass that mutated rule into the mutate function and repeat the process until the search algorithm cannot find a closer rule to the final rule.
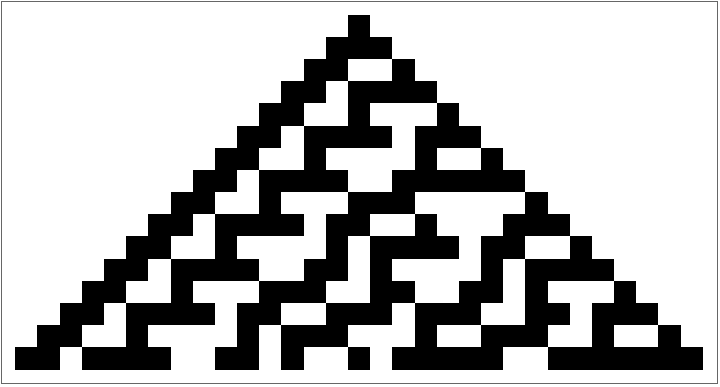
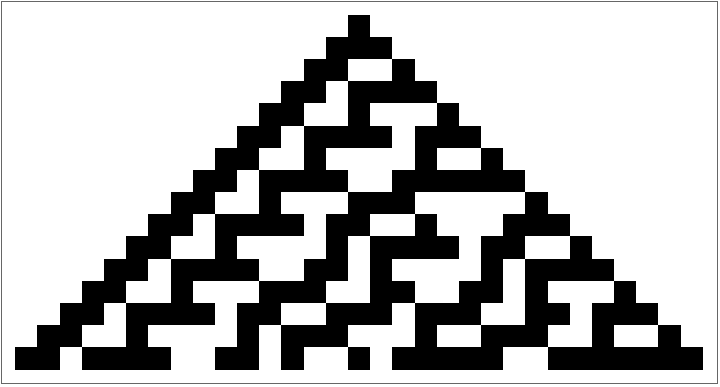
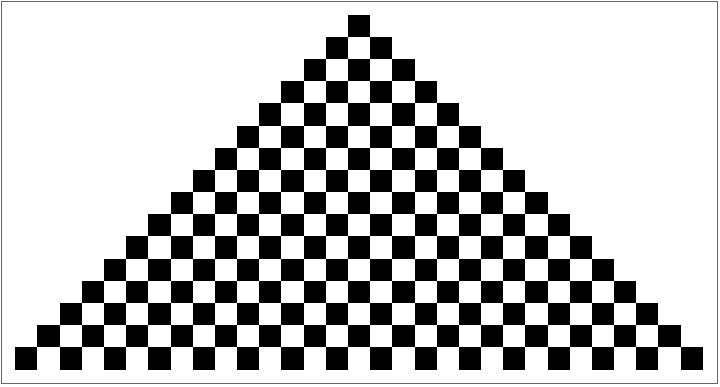
This code uses rule 30, and runs it with a 40% chance of mutating. The function mutateRule modifies rule 30, 40% of the time, so certain components of rule 30 change at random. 10 mutations of rule 30 are then displayed once the code is run. These mutations are supposed to generate images that represent the progression of an oil spill, and further represent any uncertainties or behavior changes in an oil spill.In summary, the code explores the behavior of mutated rules derived from Cellular Automaton rule 30, providing insights into the impact of rule mutations on the automaton's evolution.
This code uses rule 30, and runs it with a 40% chance of mutating. The function mutateRule modifies rule 30, 40% of the time, so certain components of rule 30 change at random. 10 mutations of rule 30 are then displayed once the code is run. These mutations are supposed to generate images that represent the progression of an oil spill, and further represent any uncertainties or behavior changes in an oil spill.In summary, the code explores the behavior of mutated rules derived from Cellular Automaton rule 30, providing insights into the impact of rule mutations on the automaton's evolution.
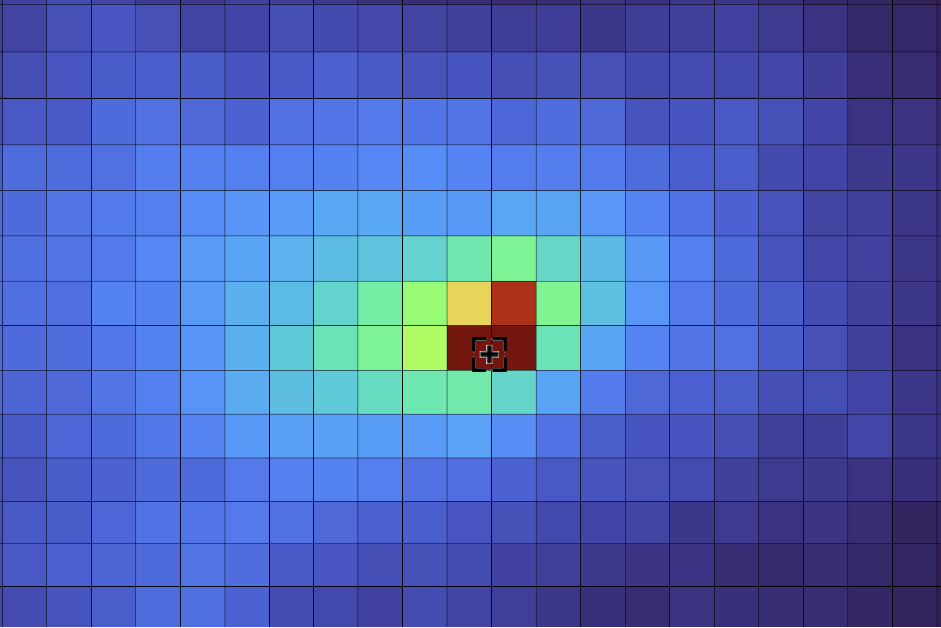
This is the oil spill image we got from the NOAA website which is the final 2D rule.
In[]:=
oilspillimage=
;
In[]:=
rules=ResourceFunction["ComputationalSystemRules"][CellularAutomaton[30]];ArrayPlot[CellularAutomaton[rules,{{1},0},15]]
Out[]=
Next we can define a mutation function called mutateRule that flips the value, 0 to 1 or 1 to 0, of a rule element with a probability given by mutationProbability.
In[]:=
mutationProbability=0.4;mutateRule[rule0_List]:=Module[{rule=rule0},((Keys[#]->If[RandomReal[]<=mutationProbability,RandomChoice[{0,1}],Values[#]])&/@rule)];
We can create and store 5 mutated rules by passing in the rule 10 times into mutateRule and pass those rules into CellularAutomata which will run it for 15 iterations. Finally we can use ArrayPlots to visualize the evolution of each mutated rule. We stored the rules in two different arrays to highlight the fact that even though the same rule is being passed into the mutation, the function will always give out a distinct array of mutated rules.
In[]:=
population=5;firstmutatedRules=Table[mutateRule[rules],population];secondmutatedRules=Table[mutateRule[rules],population];(ArrayPlot[CellularAutomaton[#,{{1},0},15]])&/@firstmutatedRules(ArrayPlot[CellularAutomaton[#,{{1},0},15]])&/@secondmutatedRules
Out[]=
,
,

,
,

Conclusion and Further Applications
Conclusion and Further Applications
This project demonstrated oil spillage on water using two different methods of analysis. We used a von Neumann neighborhood and a search function to illustrate this scenario. In order to continue this project further, we would add a search algorithm. This algorithm would take a rule and randomly mutate it. After it repeats this process multiple times, it would call another function to check how close the given rule is to the end rule. Using this, we would mutate this given rule so that every time we do so, we receive a product closer and closer to the end rule. Also, our current code describes our scenario in terms of 1D cellular automata. We would want to continue our project by rendering it closer to a 2D model instead. Finally, we would want to make our Cellular Automata oil spill model as realistic as possible by taking into account the following factors: wind velocity, celerity, surface tension, etc.
Sources
Sources
[1] Author links open overlay panelIoannis Karafyllidis, et al. “A Model for the Prediction of Oil Slick Movement and Spreading Using Cellular Automata.” Environment International, Pergamon, 24 July 1998, www.sciencedirect.com/science/article/abs/pii/S0160412097000962.
[2] Chemistry of an Oil Spill, response.restoration.noaa.gov/about/media/chemistry-oil-spill.html. Accessed 2 Jan. 2024.
[3] Desktop Gnome, response.restoration.noaa.gov/oil-and-chemical-spills/oil-spills/response-tools/gnome.html.
[4] Incident Map | Incidentnews | NOAA, incidentnews.noaa.gov/map.
[5] “Moore Neighborhood.” From Wolfram MathWorld, mathworld.wolfram.com/MooreNeighborhood.html.
[6] “Von Neumann Neighborhood.” From Wolfram MathWorld, mathworld.wolfram.com/vonNeumannNeighborhood.html.
CITE THIS NOTEBOOK
CITE THIS NOTEBOOK
Cellular Automata Modeling of Oil Spills
by Wolfram Emerging Leaders Program
Wolfram Community, STAFF PICKS, January 3, 2024
https://community.wolfram.com/groups/-/m/t/3095845
by Wolfram Emerging Leaders Program
Wolfram Community, STAFF PICKS, January 3, 2024
https://community.wolfram.com/groups/-/m/t/3095845