Classic Logistic Map
Classic Logistic Map


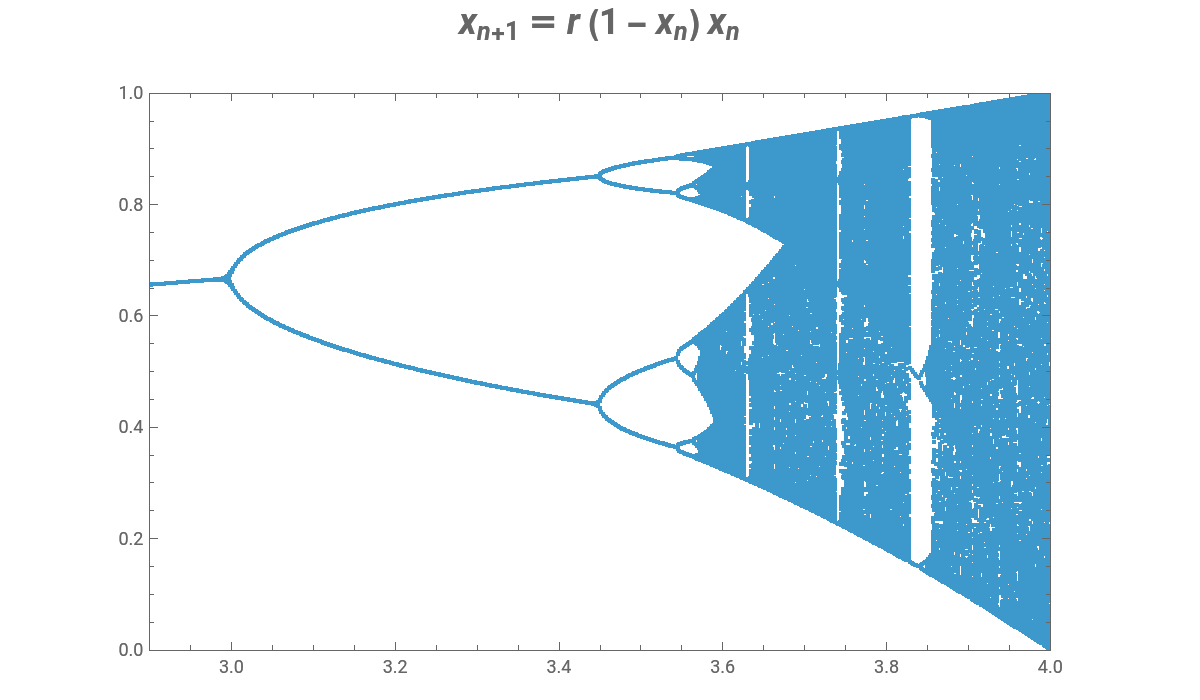
The classic logistic map is widely used to show the properties of chaotic dynamics. This version lets you explore and enlarge different areas of the map to show its fractal nature. As the magnification increases, it is helpful to increase the number of points that are plotted.
Details
Details
The classic logistic map is widely used to illustrate chaos and bifurcation. This is especially useful in demonstrating and teaching chaos. The snapshots show the similarity in appearance of the map as you zoom in on the areas of bifurcation, sometimes known as scale invariance.
This formulation is modified from that given in the book by H. Ruskeepää, Mathematica Navigator, 3rd ed., San Diego, CA: Academic Press, 2009 p. 941 ff. This book is highly recommended for users of Mathematica 6 or 7.
A major reference is R. M. May, "Simple Mathematical Models with Very Complicated Dynamics," Nature, 261, 1976 pp. 459–467. Another widely used reference is J. Gleick, Chaos: Making a New Science, London: Viking Penguin, 1987 and 2008.
External Links
External Links
Permanent Citation
Permanent Citation
Robert M Lurie, Heikki Ruskeepää
"Classic Logistic Map"
http://demonstrations.wolfram.com/ClassicLogisticMap/
Wolfram Demonstrations Project
Published: March 7, 2011