COVID-19 has been around for some years now. Recently, I thought it may be possible to use Wolfram Language to find some insights in the data surrounding this topic. Let's get right on to it!
One big challenge I find with data visualization is, well, getting the data and making it structured. For this post, I am using a Telegram channel I have been following that publishes lots of regional news on COVID-19 very regularly. The channel is in Chinese, but I suppose my methods here can be applied to other languages as well.
As usual some helper functions:
ClearAll[pipe,branch,branchSeq]pipe=RightComposition;branch=Through@*{##}&;branchSeq=pipe[branch[##],Apply[Sequence]]&;
First, I need to get the raw data. Fortunately, this is as simple as a URLRead call:
resp=URLRead["https://t.me/s/nCoV2019"]
Out[]=

The website returns data in regular HTML, but the XML parser in Wolfram Language seems to handle it just fine. Thanks for the strict syntax of XMLElement, it's easy to go further and transform the XMLObject into a nested Association with a help of simple replacement rules.
In[]:=
xml=resp["Body"]//ImportString[#,"XMLObject"]&;
Out[]//Short=
XMLObject[Document][{XMLObject[Declaration][Version1.0,EncodingUTF-8,Standaloneyes]},1,{}]
In[]:=
assoc=xml//pipe[ReplaceRepeated[XMLElement[t_,a_,d_]:>Inactive[Association]["tag"->t,"attr"->KeyMap[ToString,StringSplit[#,Whitespace]&/@Association[a]],"data"->d]],Activate,#〚2〛&];
Note the result is nice enough to be exported as JSON (although I won’t need that):
assoc//pipe[ExportString[#,"RawJSON","Compact"->4]&,StringSplit[#,"\n"]&,Join[#〚;;5〛,{"⋮"},StringJoin[StringTake[#,UpTo[40]],"⋯"]&/@#〚40;;41〛,{"⋮"}]&,Riffle[#,"\n"]&,StringJoin]
Out[]=
{ "tag":"html", "attr":{ "{http:\/\/www.w3.org\/2000\/xmlns\/, xmlns}":[ "http:\/\/www.w3.org\/1999\/xhtml"⋮ {"tag":"link","attr":{"rel":["apple-⋯ {"tag":"link","attr":{"rel":["icon"]⋯⋮
I want to further investigate the data. So to make data querying easy, I now convert the nested Association into a Dataset:
ds=Dataset[assoc]
Out[]=

There are a few things I am concerned with. First one is of course extracting the data I want. As said, it is very easy to query the Dataset. With two helper functions to make the code cleaner, the process works in a hierarchical way.
In[]:=
ClearAll[tagSelector,classSelector]tagSelector[t_String]:=pipe[Select@AssociationQ,Select[#tag===t&]]classSelector[cls_String]:=pipe[Select@AssociationQ,Select[MemberQ[#attr["class"],cls]&]]
ds["data",tagSelector@"body","data",tagSelector@"main","data",classSelector@"tgme_container","data",classSelector@"tgme_channel_history","data",classSelector@"tgme_widget_message_wrap"]
For a most simple analysis, I only need hashtags and timestamp of each news, so I extract them on the fly:
In[]:=
hashtags=ds[pipe["data",#〚1,1,1,1〛&,Apply@Join],tagSelector@"body","data",tagSelector@"main","data",classSelector@"tgme_container","data",classSelector@"tgme_channel_history","data",classSelector@"tgme_widget_message_wrap",pipe["data",#〚1,1〛&],;;,"data",classSelector@"tgme_widget_message_bubble",pipe["data",Thread],pipe[classSelector@"js-message_text",First,"data" ,Cases[#,a_Association/;a["tag"]==="a",∞]& ,Select[MatchQ[#data,{_String?(StringStartsQ["#"])}]&] ,Map[StringDrop[#data〚1〛,1]&]],pipe[classSelector@"js-message_footer",Cases[#,a_Association/;a["tag"]==="time",∞]&,First,"attr","datetime",First,DateObject]]//Normal;
hashtags〚;;3〛//TableForm
Out[]//TableForm=
疫情通报 | |
紧急寻人 | |
甘肃 |
One other thing is that the URLRead call only returned the latest couple of news. To access older news I need to extract the "next page" link:
nexturl=ds["data",pipe[Select[#tag==="head"&],Flatten,First],"data",pipe[Select[#tag==="link"&],Select[MemberQ[#attr["rel"],"prev"]&]],pipe[#attr&,#href&]]
Out[]=
/s/nCoV2019?before=21930
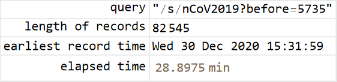
The entire process can now be automated as a loop, which will give me all the news until the first day. To monitor the progress I also make a simple dashboard.
In[]:=
query="";hashtags={};earliest=Now;stopFlag=False;
Button["Stop",stopFlag=True]Grid[{{"query","length of records","earliest record time","elapsed time"},{Dynamic[Style[query,ShowStringCharacters->True]],Dynamic[Length@hashtags],Dynamic[DateString@earliest],Dynamic[query;Now-timeStart]}},Alignment->{{Right,Left},Center},Frame->All]
Out[]=
Out[]=
stopFlag=False;Echo[timeStart=Now,"start"];Module[{resp,xml,ds},While[!stopFlag&&earliest>DateObject[{2020,1,21,0,0,0.}],resp="t.me/s/nCoV2019"<>query//URLRead;If[Head[resp]=!=HTTPResponse,Return[resp,Module],If[resp["StatusCodeDescription"]=!="OK",Return[Failure["urlrd",resp["StatusCodeDescription"]],Module]]];xml=resp["Body"]//ImportString[#,"XMLObject"]&;ds=xml//pipe[ReplaceRepeated[XMLElement[t_,a_,d_]:>Inactive[Association]["tag"->t,"attr"->KeyMap[ToString,StringSplit[#,Whitespace]&/@Association[a]],"data"->d]],Activate,#〚2〛&,Dataset];query=ds["data",pipe[Select[#tag==="head"&],Flatten,First],"data",pipe[Select[#tag==="link"&],Select[MemberQ[#attr["rel"],"prev"]&]],pipe[#attr&,#href&]];ds[pipe["data",#〚1,1,1,1〛&,Apply@Join],tagSelector@"body","data",tagSelector@"main","data",classSelector@"tgme_container","data",classSelector@"tgme_channel_history","data",classSelector@"tgme_widget_message_wrap",pipe["data",#〚1,1〛&],;;,"data",classSelector@"tgme_widget_message_bubble",pipe["data",Thread],{pipe[classSelector@"js-message_text",First,"data",Cases[#,a_Association/;a["tag"]==="a",∞]&,Select[MatchQ[#data,{_String?(StringStartsQ["#"])}]&],Map[StringDrop[#data〚1〛,1]&]],pipe[classSelector@"js-message_footer",Cases[#,a_Association/;a["tag"]==="time",∞]&,First,"attr","datetime",First,DateObject]}]//Normal//(hashtags=Join[#,hashtags])&;earliest=hashtags〚1,2〛;Pause[3.]]]Echo[timeEnd=Now,"end"];
The exercise took about 1.5 hours to go all the way back to the start of COVID-19. Now I have acquired a fairly large amount of records stored in hashtags.
A simple grouping shows that ASCII tags with digits are mostly airline numbers, while ASCII tags without digits are mostly region names:
Now time for some data analysis. Since I have hashtags and timestamps only, I first try my hat by creating an EventSeries from all timestamps:
By processing es with TimeSeriesAggregate, I hope to show the daily frequency of news for the past years, with the presumption that higher frequency means more "heated" times:
My first try looks promising. I now do the same but only on selected records with "Delta" and "Omicron" hashtags:
Here alternatively I use MovingMap to aggregate es with window of 1 month wide and step of 1 week length:
From the chart, we can see a sudden spike in Omicron-related news around the end of last year:
Now let's look at things by geography. The news hashtags both global and region specific news. It also adds the "疫情动态" tag to indicate that the report is a summary about the number of infection incidents in a particular region. I want to look at the global trend, also for a few major Chinese cities.
Comparing the virus variant and geographic graph side by side, I think the shape of Omicron in the first graph follows the shape of all trending news (indicated by “Trend” line) very closely ever since the Omicron tag starts appearing. Also it can be seen that Omicron has a similar shape to Shanghai's latest outbreak this year.
This is my very simple attempt at data analysis that looks at hashtags only. I am sure there are a lot more insight embedded in the news content that awaits discovery, although it would probably require more sophisticated NLP techniques.