Dams and Bridges are two of the most important architectural structures that are built on rivers. In this computational essay, we explore them in detail and use WL's functionality to try and understand more from their data-points. Data-points are used to gain insights about Population-Density, River-Widths, Tributaries and Distributaries. We isolate dams from satellite images using color-processing. We also model the area of dams using geo-coordinates and the depth of dams using bathymetry and neural networks. In addition to this, we introduce the notion of bridge-density.
Merit for Analyzing Population Density Models
Merit for Analyzing Population Density Models
Calculating population density can tell us how "at-risk" an area is at risk for flooding, hence an important metric to measure. While there are some built-in functions (GeoRegionValuePlot), the functional range is too limited and small.
Large Scale Modeling of River Width
Large Scale Modeling of River Width
We can model the river width of a certain river and its contributing tributaries through determining the length of notable bridges that cross the river from its origin to its delta. Specifically, we will use the functions FilteredEntityClass and GeoRegionValuePlot to create our river width weights.
Here is an example from the Missouri River, let’s name it bridgeMissouri:
In[]:=
missouriRiver=EntityClass"River","Outflow"->//EntityList;bridgeMissouri=FilteredEntityClass"Bridge",EntityFunctionx,!MissingQ[x["Position"]]&&ContainsAnyx["Crosses"],AppendmissouriRiver,//EntityList;GeoRegionValuePlot[EntityValue[bridgeMissouri,"Length","EntityAssociation"],AspectRatio->1,MissingStyle->Transparent,GeoBackground->"Satellite"]
A more comprehensive example that incorporates the river delta in relation with the origin is the Mississippi River
Here, we can see the gradual increase of river width as it moves towards the river delta, let's name it bridgeMississippi:
Here, we can see the gradual increase of river width as it moves towards the river delta, let's name it bridgeMississippi:
In[]:=
mississippiRiver=EntityClass"River","Outflow"->//EntityListbridgesMississippi=FilteredEntityClass"Bridge",EntityFunctiony,!MissingQ[y["Position"]]&&ContainsAnyy["Crosses"],AppendmississippiRiver,//EntityList;MississipiPlot=GeoRegionValuePlot[EntityValue[bridgesMississippi,"Length","EntityAssociation"],AspectRatio->1,MissingStyle->Transparent,GeoBackground->"Satellite"]
Out[]=
,,,,,,,,,,,,,,,,,,,,,,,,,,,,,,,,,,,,,,,,,,,,,,,,,,,,,,,,,,,,,,,,,,,,,,,,
Out[]=
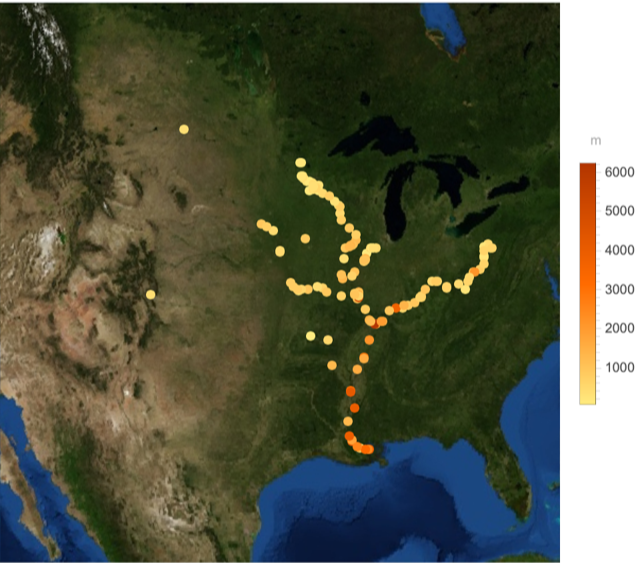
The code in this section has been adapted from WaterGate : A project that was created by the author and George Cheng .
Using Bridges and Their Data
Using Bridges and Their Data
Getting tributaries for the famous Hudson River using the Outflow Functionality
In[]:=
hudsonRiver=EntityClass"River","Outflow"->//EntityList
Out[]=
,,,,,,,,,,,,,,,,,,,,,,
Creating a filtered entity class for those bridges that cross the hudson and it's tributaries and for which the position property is available
In[]:=
bridgeHudson=FilteredEntityClass"Bridge",EntityFunctionx,!MissingQ[x["Position"]]&&ContainsAnyx["Crosses"],AppendhudsonRiver,//EntityList
Out[]=
,,,,,,,,,,,,,,,,,,,,,,,,,,,,,,,,,,,,,,,,,,,,,,,,,,
GeoRegionValuePlot on a Satellite Map
In[]:=
HudsonBridges=GeoRegionValuePlot[EntityValue[bridgeHudson,"Length","EntityAssociation"],AspectRatio->1,MissingStyle->Transparent,GeoBackground->"Satellite"]
Out[]=
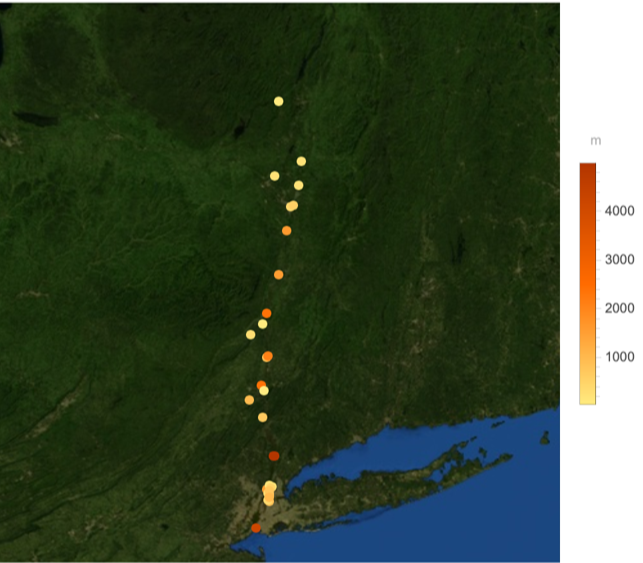
Population Density of New York State and the length of bridges in meters on the same graph
In[]:=
Show[{NY,HudsonBridges}]
Out[]=
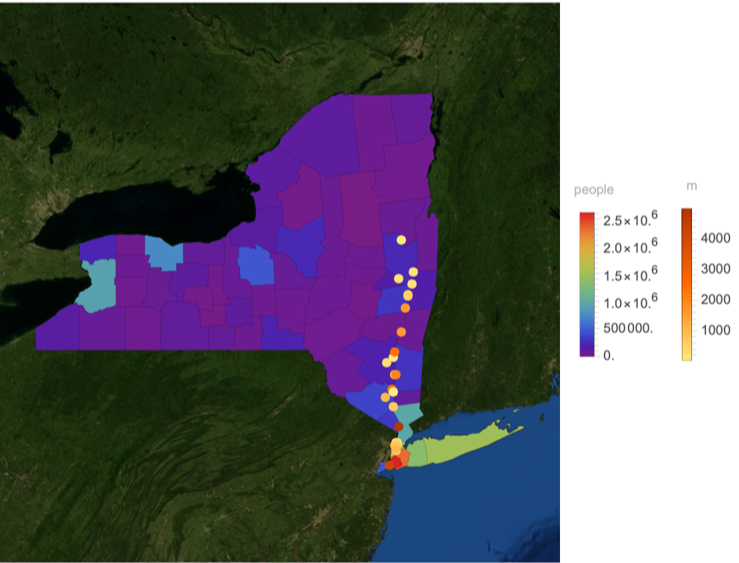
There seems to be some correlation between the population density of a place, and the length of the it's longest bridge (on the hudson river and it's tributaries).
Now, we plot the graph of the Mississippi River with respect to the population of states in the United States
Study of Bridges in Cities
Study of Bridges in Cities
Bridge Density
Bridge Density
We define the bridge density of a city to be the percentage of area covered by bridges to the percentage of area covered by water
Hence, the percentage covered by Bridges in New York is 2.7%
Hence, water covers approximately 18.3865% of New York.
We can wrap all of this up neatly in a function.
Comparing Branching of Rivers and Bridges
Comparing Branching of Rivers and Bridges
It seems intuitive to think that bridges would be strategically placed at places where a river meanders or branches. However, empirical data from New York shows that this is not necessarily the case
Extract river from the image & Use Cleaning Functions such as Thinning, DeleteSmallComponents, Dilation, ColorNegate to obtain an accurate image of rivers
Use Morphological Branch Points to judge where the river meanders/branches
Rivers of New York State
Using Dams & Their Data
Using Dams & Their Data
Extracting Dams from Satellite Images
Extracting Dams from Satellite Images
Extracting the dam using the same methods as before
Hence, the Tehri cover approximately 2.44169% of the surrounding area
An Attempt to Compute the Volume & Area of Dam using Satellite Images
An Attempt to Compute the Volume & Area of Dam using Satellite Images
Finding Area
Finding Area
Creating a dam contour by manually using the Geo-Coordinates Tool
The area is relatively accurate.
Finding Depth
Finding Depth
a) Using pure bathymetric functions
a) Using pure bathymetric functions
Use bathymetry to find the volume
b) Using Neural Networks
b) Using Neural Networks
Code for the area has been provided by Gianluca Gorni, University of Udine
Plotting Dams & Bridges on the same Map
Plotting Dams & Bridges on the same Map
Creating Functions
Creating Functions
In this section, we create a bunch of helper-functions to perform operations on Dams using their properties
Create EntityClass of all the dams on a particular river
Get the position of all the Dams
Position for the Ganges River
Get Images of Dams on a particular River
Assort Dams by their length in Descending order
Tying Everything Together
Tying Everything Together
Create an entity class of all the tributaries of the Mississippi river
Create an entity class of all the Dams of the Mississippi river and it's tributaries if and only if their positions are known
In[]:=
Map of Dams and Bridges of the Mississippi River
This shows a positive correlation between the location of tall dams and long bridges.
CITE THIS NOTEBOOK
CITE THIS NOTEBOOK
Holistic examination of bridges & dams for analysis of river-systems
by Navvye Anand, Student Ambassador - Wolfram Research
Wolfram Community, STAFF PICKS, September 27, 2023
https://community.wolfram.com/groups/-/m/t/3022090
by Navvye Anand, Student Ambassador - Wolfram Research
Wolfram Community, STAFF PICKS, September 27, 2023
https://community.wolfram.com/groups/-/m/t/3022090