Plot of Dow Jones index and the Ethereum cryptocurrency (ETH)
Plot of Dow Jones index and the Ethereum cryptocurrency (ETH)
This plots the two sets of data since 1/1/2021
In[]:=
Setadaterangetodisplaydata.
In[]:=
date="1/1/2021";
Plot the Dow Jones Index
Plot the Dow Jones Index
In[]:=
DateListPlot[FinancialData["^DJI",date]]
Out[]=
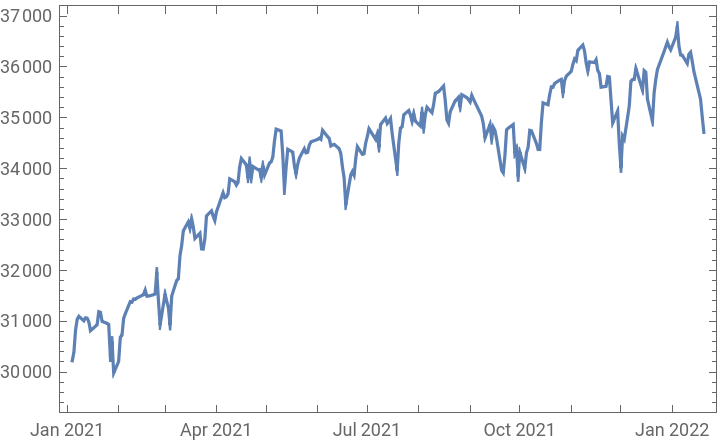
A sensible y-axis is automatically computed - around 29,000 to 37,000.
Plot the value of Ethereum in USD
Plot the value of Ethereum in USD
In[]:=
DateListPlot[FinancialData["ETH/USD",date]]
Out[]=
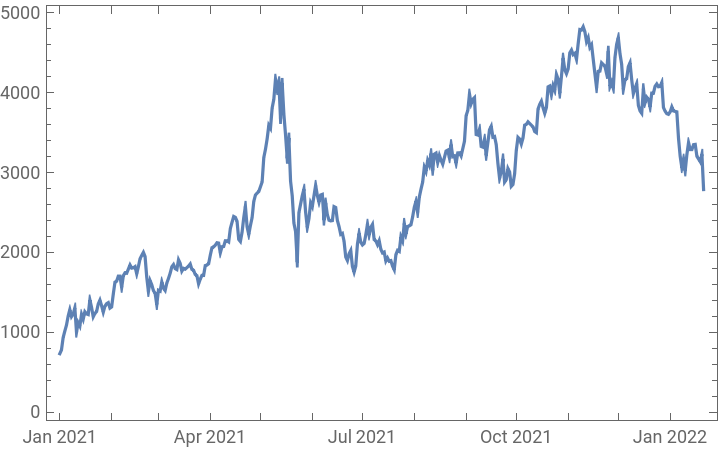
A sensible y-axis is automatically computed - around 0 to $5000.
Now plot both sets of data on one graph .
Now plot both sets of data on one graph .
In[]:=
DateListPlot[{FinancialData["^DJI",date],FinancialData["ETH/USD",date]},PlotLabel->"Dow Jones Index and etherumm"]
Out[]=
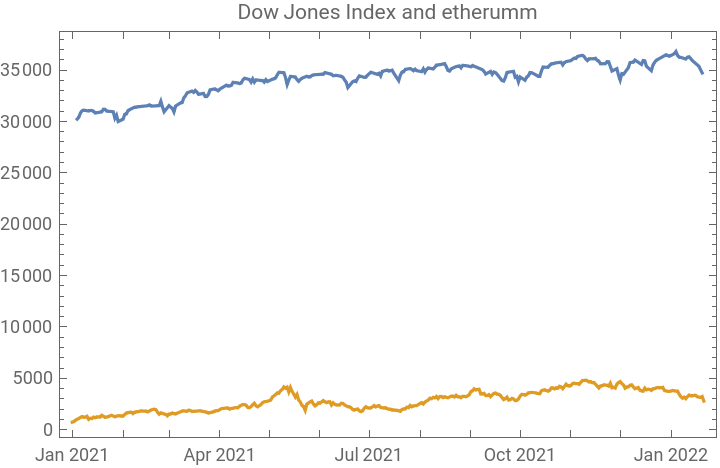
I' ve got a few problems with this .
I' ve got a few problems with this .
1) How can I label the above graph so one can see what is the Dow Jones Index and what is Ethereum?
2) Can I put the two sets of data on different y-axes? Ideally $0-$5000 for Ethereum, and 29,000 to 37,000 for the Dow Jones Index?
3) Is is possible to compute any sort of correlation coefficient between these?
2) Can I put the two sets of data on different y-axes? Ideally $0-$5000 for Ethereum, and 29,000 to 37,000 for the Dow Jones Index?
3) Is is possible to compute any sort of correlation coefficient between these?