Cross Sections of Graphs of Functions of Two Variables
Cross Sections of Graphs of Functions of Two Variables


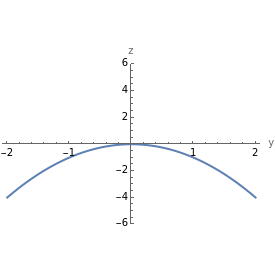

The graph of a function of two variables can be better understood by looking at slices, or cross sections, of the graph parallel to the or planes. Slicing is equivalent to holding (or ) constant at and looking at the graph of the resulting single-variable function (or , respectively). This Demonstration helps students connect the slice on the 3D graph of with the 2D graph of or in its own right.
f(x,y)
xz
yz
x
y
c
f(c,y)
f(x,c)
f(x,y)
f(x,c)
f(c,y)
External Links
External Links
Permanent Citation
Permanent Citation
Joshua Sabloff, Stephen Wang
"Cross Sections of Graphs of Functions of Two Variables" from the Wolfram Demonstrations Project http://demonstrations.wolfram.com/CrossSectionsOfGraphsOfFunctionsOfTwoVariables/
Published: March 7, 2011