Imagine an infinite chessboard stretching beyond the reaches of our imagination. Now suppose that the board was labeled in a spiral formation, placing the number 0, at the origin, 1 to the right, 2 above the 1, and so forth. This project explores the graphs and patterns created by placing knights of various colors on the board and how we can apply similar ideas to other chess pieces, including those that aren’t in the game. It also explores how we can identify patterns in these graphs and which types of graphs create them. It shows the importance of piece order in creating graphs and how complicated graphs can eventually settle into a cohesive pattern.
Introduction
Introduction
Consider a chessboard with infinitely many squares, and label one of the squares as 0. Taking that square as an auxiliary “origin” of the coordinate and labeling the squares in a spiral formation from the right, the chessboard would look like the following:
Helper functions that helps create a diagram for the spiral chessboard (indexToCoords function will be defined later)
Creating a chessboard square when given an index:
In[]:=
chessSquare[index_]:=Rectangle[indexToCoords[index]-{0.5,0.5},indexToCoords[index]+{0.5,0.5}]
Creating a chessboard of radius n:
In[]:=
chessBoardSquare[n_]:=Module[{max=4*n*(n-1)},Map[If[EvenQ[#],chessSquare[#]]&,Range[0,max,1]]]
Making odd number cells:
In[]:=
chessBoardOddNumbers[n_,size_]:=Map[If[OddQ[#],Text[Style[#,FontSize->size],indexToCoords[#]]]&,Range[0,n,1]]
Making even number cells:
In[]:=
chessBoardEvenNumbers[n_,size_]:=Map[If[EvenQ[#],Text[Style[#,FontSize->size],indexToCoords[#]]]&,Range[0,n,1]]
Creates a chessboard with a red spiral outline:
Graphics[{EdgeForm[{Thin,Black}],chessBoardSquare[3],chessBoardOddNumbers[24,10],White,chessBoardEvenNumbers[24,10],FaceForm[None],EdgeForm[{Thick,Yellow}],Rectangle[{-0.5,-0.5},{0.5,0.5}],Red,Thick,Line[{{0.5,-0.5},{1.5,-0.5},{1.5,1.5},{-1.5,1.5},{-1.5,-1.5},{2.5,-1.5},{2.5,2.5},{-2.5,2.5},{-2.5,-2.5},{2.5,-2.5}}]},ImageSize->Small]
Out[]=
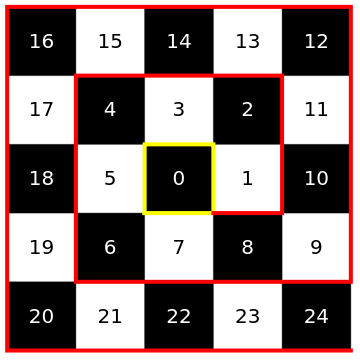
Upon examining the chessboard diagonals, one can easily notice that all even squares lie on a diagonal and all odd squares lie on a separate diagonal, which makes it convenient to visualize the new quadrants defined by the diagonals. Since the coordinates of squares numbers are trivial, other coordinates can be based off of them. Then, every other number is between two consecutive square numbers. It can first be split into two cases based on the parity of the lower cell. If the lower square is odd, the cell is in the top or right section, and if it is even, the cell is in the bottom or left. Cases can be split further by determining whether the index is closer to the square above or below it both vertically and horizontally, which yields four cases.
For convenience, function was created to convert a number into the coordinates for the cell labeled by that number.
In order to create this function, four cases have to be considered.
For convenience,
indexToCoords
In order to create this function, four cases have to be considered.
Creating a chessBoard of radius n with all the numbers being labeled with a given font size:
In[]:=
chessBoard[n_,size_]:={EdgeForm[{Thin,Black}],chessBoardSquare[n],chessBoardOddNumbers[4*n*(n-1),size],White,chessBoardEvenNumbers[4*n*(n-1),size]}
Demonstrating how the infinite board is split into 4 parts:
Graphics[{chessBoard[5,10],Green,Map[chessSquare,{2,12,30,56,6,20,42,72}],Orange,Map[If[IntegerQ[Sqrt[#]],chessSquare[#]]&,Range[0,80,1]],White,chessBoardEvenNumbers[80,10],Black,chessBoardOddNumbers[79,10]},ImageSize->Small]
Out[]=
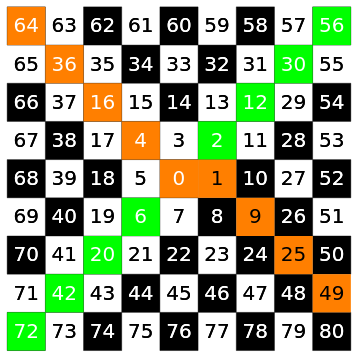
In the diagram above, orange represents the perfect square numbers, which are checked first in the function . Afterwards, the function checks whether the perfect square number below the index is an odd square or an even square. The final part of the function determines on which side of the green diagonal the index is located, and finally bases the coordinates after the nearest square number, whose coordinates were assigned in the first test.
indexToCoords
Finding the coordinates of the cell marked by an index depending on what part of the grid it is in:
In[]:=
indexToCoords[x_]:=Which[IntegerQ[Sqrt[x]],If[EvenQ[x],{-Sqrt[x]/2,Sqrt[x]/2},{Ceiling[Sqrt[x]/2],-Floor[Sqrt[x]/2]}],OddQ[Floor[Sqrt[x]]],If[x>Floor[Sqrt[x]]*(Floor[Sqrt[x]]+1),indexToCoords[Power[Ceiling[Sqrt[x]],2]]+{Power[Ceiling[Sqrt[x]],2]-x,0},indexToCoords[Power[Floor[Sqrt[x]],2]]+{0,x-Power[Floor[Sqrt[x]],2]}],True,If[x>Floor[Sqrt[x]]*(Floor[Sqrt[x]]+1),indexToCoords[Power[Ceiling[Sqrt[x]],2]]-{Power[Ceiling[Sqrt[x]],2]-x,0},indexToCoords[Power[Floor[Sqrt[x]],2]]-{0,x-Power[Floor[Sqrt[x]],2]}]]
The coordsToIndex function does something similar. It first sets the base as the diagonals, and then builds on from the diagonal where the coordinate is, split similarly as above.
Inverse of indexToCoords with a similar algorithm:
In[]:=
coordsToIndex[{x_,y_}]:=Which[Abs[x]==Abs[y],If[x>=0,If[y>=0,(2*x-1)*2*x,2*x*(2*x+2)],If[y>=0,(4*x^2),2*x*(2*x-1)]],Abs[x]>Abs[y],If[x>0,(2*x-1)^2+x-1+y,4*x^2-x-y],True,If[y>0,4*y^2-y-x,2*y*(2*y-1)-y+x]]
In order to run later functions faster, creating a lookup version of both and is optimal, because then instead of running the calculation hundreds or thousands of times, an item can just be found in a list, which is a lot faster.
indexToCoords
coordsToIndex
Note that the lookup capacity is currently at 250,000 so the later functions are guaranteed to work for <50,000 pieces (approximately 1/5 of the lookup size).
Creating a Lookup version of two functions that would allow faster evaluation for later code:
In[]:=
indexToCoordsLookup=AssociationThread[Range[0,250000,1],Map[indexToCoords,Range[0,250000,1]]];coordsToIndexLookup=AssociationThread[Values[indexToCoordsLookup],Keys[indexToCoordsLookup]];
Black Knights
Black Knights
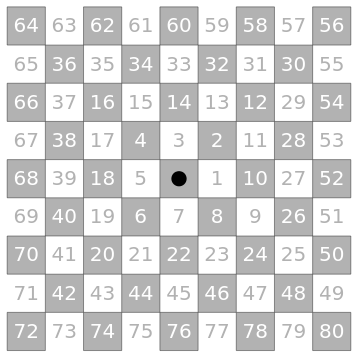
Suppose that there was a knight on cell 0. Going onto cell 1, if it is under attack by another knight, the cell is ignored; if not, a knight is placed there. The same algorithm is then applied iteratively. This logic guarantees that no knights attack one another, and that each successive knight is placed on the lowest possible index. As more and more knights are placed on the board, every cell either gains a knight or is attacked by one or more. Essentially, every turn, a knight is placed on the lowest possible index so that it isn’t attacked by another knight.
Making a diagram representing the starting state:
Graphics[{RGBColor[0.7,0.7,0.7],chessBoard[5,10],Black,Disk[{0,0},0.2]},ImageSize->Small]
Out[]=
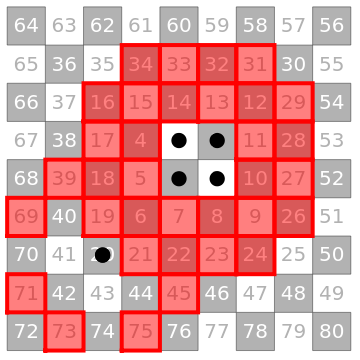
The first four knights are simply placed on cells 0, 1, 2, and 3. However, the fifth knight is a little farther away, being placed on cell 20.
Representing the first 5 black knights and what squares they can attack:
Graphics[{RGBColor[0.7,0.7,0.7],chessBoard[5,10],Black,Map[Disk[indexToCoords[#],0.2]&,{0,1,2,3,20}],Disk[{-2,-2},0.2],Opacity[0.5],Red,EdgeForm[{Thick,Red}],Map[chessSquare,Join[Range[4,19,1],Range[21,24,1],{26,27,28,31,32,33,39,69,71,73,75,45,29,34}]]},ImageSize->Small]
Where the black knights are located in a 13 x 13 grid:
Graphics[{RGBColor[0.7,0.7,0.7],chessBoard[7,5],Black,Map[Disk[indexToCoords[#],0.2]&,{0,1,2,3,20,25,30,35,36,37,40,41,42,47,48,49,54,55,56,63,65,70,79,88,94,95,110,112,114,115,121,123,125,126,132,134,137,138,141,143,144,145,147,149,150,152,154,155,156,162,165,167,168}]},ImageSize->Small]
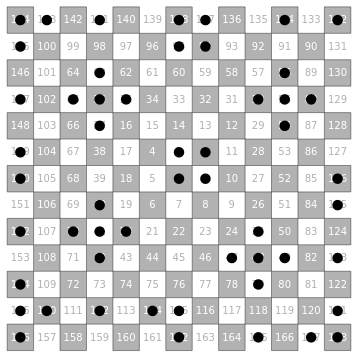
In order to implement a function to find the indices of the first n knights, a helper function that finds the lowest available cell given a list can be made.
Helper function to find the next possible placement given a list of restricted squares:
Now, given an integer n, the indices of the first n knights can be found for any chessboards.
Finding the indices of first n blackKnights:
The indices of black knights are then plotted for visualization.
Plots the indices on a ListPlot:
For the first 1,000, the plot looks as follows:
Graphing the first 1000 black knights:
In this particular chessboard, one can identify a few patterns that would essentially predict what the graph would look like at any point in it, no matter how big it is and how far it is from the origin. The most prominent pattern occurs in the four corners, where rows and columns alternate between a cross created from 5 knights and a single knight. On the positive portion of the y-axis, there is a pattern of 2 and 4. On the negative portion of the y-axis, there exists an alternating pattern of the same cross from before minus the knight on the right as well as a single knight separated by one space. On the positive x-axis, the same is true, except this time the top knight of the cross is missing rather than the right knight. On the negative x-axis, one could observe a pattern of 2 repeating every 6. Thus, there is no randomness, meaning everything is recurring. If given some index or coordinate in the infinite chessboard, one would be able to predict if a knight is placed there or not.
Red and Black Knights
Red and Black Knights
Suppose that instead of one color, red and black knights are used. The first knight would be black, the second red, and so on. This time, however, the rules are modified so that the knights of the same color can attack each other.
Places black and red pieces on a chess board with a certain radius and font size
Helper function that returns possible places to move given an x- and y-coordinate:
This returns two lists: the first containing the indices of the Black Knights and the second containing the indices of the Red Knights.
Now, those indices can be graphed for pattern finding purposes.
Plotting red and black pieces in a plane:
At first, there doesn't seem to be a pattern. Even though quadrant 1 seems to be similar to quadrant 3 inverted, there is no actual symmetry or pattern (e.g. there is only one disconnected blob in the first quadrant but there are two in the third). There is no concrete way to predict anything about the graph up to this point because there is no exact symmetry or pattern, hence many questions arises from the result. One might wonder, why can no pattern stick? Why does this oval-looking shape seem so common? Why is there a random string of red knights in the far right corner?
For this graph though, there are only the first 100,000 black knights and the first 100,000 red knights were tracked. If there were, say 64 million cells, or a square of 8,000 by 8,000, a pattern would start to emerge, and it would never stop. Patterns with monotonic large sections are hard to break because the knights in the section guard the perimeter. It can only be broken if the other color was already “ahead”, or was placed on higher numbers, which cannot be true because the pattern has held for so long. As the graph gets larger and larger in scale, the other color needs to be farther and farther “ahead” in order to break the pattern because the amount needed to increase by a radius of one increases. If the pattern hasn’t been broken already, it will remain that way indefinitely as the required difference between the knights in order to break the pattern increases.
It is observable that the top two quadrants are dominated by red and the bottom two by black. However, some parts of the graph do not have so clean a pattern. Why do so many knights need to be placed for a pattern to emerge? It shouldn’t be too difficult to maintain a block of a certain color, because a block of knights attacks the perimeter around it. As mentioned above, blocks mainly break when one piece is consistently being placed on higher numbers than others. Why is that happening, and which color is faster than the other?
Fairy Chess
Fairy Chess
A knight moves symmetrically across 4 different line, generating 8 different places to move. Thus, in order to maintain symmetry, one would only need to focus on a select few squares, and then just reflect it across the lines to generate the other cells that would be attacked.
Given a number and a radius (which tells it how far out it should go), it returns where in top part of the top right quadrant a piece can move to:
For example,
is where a knight can move to in that part of the square. Then, in order to translate that to every possible move, the following function is created:
Given a number and a radius, it returns everywhere a piece can move:
It would be best, for future purposes, to create a function that inputs where black and red pieces can move and outputs the indexes of those pieces. This would allow for any type of piece, not just knights. Taking a knight as an example, the input would look like the following: {{1,2},{2,1},{-1,2},{2,-1},{1,-2},{-2,1},{-1,-2},{-2,-1}}.
Given a value n and moves for black and red pieces, this returns the indices of the first n black pieces and the first n red pieces:
Instead of inputting the vectors that the pieces can use, it is simpler to only input the number of what moves the piece can move, since only these functions are being used for pieces that move symmetrically.
Given a value n and numbers that correspond to moves for black and red pieces, this returns the indices of the first n black pieces and the first n red pieces:
Plotting and visualizing functions would also be useful in order to see the patterns.
Plotting the locations of Black and Red Pieces:
Visualizing where a piece can move given a number corresponding to where a piece can move:
This then allows visuals to be created by different pieces. For example, if these two simple pieces were used:
We can get the following graph:
The first 10,000 pieces when using the two pieces shown above:
Pattern Checking
Pattern Checking
A lot of the graphs created by two pieces have fairly noticeable patterns. However, it is rather difficult to hand-detect patterns for each and every single graph. To facilitate the pattern detection, the following function is implemented:
Determining the length of the earliest pattern that repeats a certain amount of times in a list:
It is also useful all the coordinates in a rectangle given the bottom-left and top-right corners.
Returning all the coordinates in a rectangle:
Finally, in order to detect a pattern, there needs to be some data to detect a pattern from. So then a function was made that takes a list of black numbers and red numbers, finds the biggest square that is filled out by both colors and then creates a list of lists for the coordinates of that square, assigning 1 to the number if a black piece is there, a 2 if a red piece is there, and a 0 if neither.
Returning the positions of black and red pieces in the biggest filled out square:
For example,
Here we can see the first graph be simplified to the first full spiral, and then translated to a list of lists.
There could be a function that scans if there is a pattern in a certain rectangle of a graph. It takes the rectangle with a certain width, scans it, then returns the length of the first pattern that repeats a certain amount of times.
Returning length of first pattern that appears when scanning from down from the top:
Creating a diagram that represents how the graphPatternTestingDown function scans a graph:
Similarly, functions for scanning from bottom-up can be made. The difference between the two is minimal, because it only appears when there are two patterns of different lengths. Because both return the first pattern they find, if there was a pattern of length two at the top and length three at the bottom, you would get varying results each time you reverse the order of the pattern finding algorithm.
Finding a pattern when scanning up from the bottom:
Testing for a pattern when scanning from left to right:
Testing for a pattern when scanning from right to left:
Making a filled-in LShape that has its bottom-left square at the given coordinate:
Making an LShape outline that has its bottom-left square at the given coordinate:
Creating a diagram that represents how the graphPatternTestingBRCorner function scans a graph:
Finding the length of the first pattern starting from the Bottom-Right Corner:
Finding the length of the first pattern starting from the Bottom-Left Corner:
Finding the length of the first pattern starting from the Top-Left Corner:
Finding the length of the first pattern starting from the Top-Right Corner:
With these functions, it is then possible to create one that checks if a pattern exists consistently across the graph. If there is a pattern coming from all of these functions, it is reasonable to conclude that there exists a strong, repeating pattern. Additionally, should there be a pattern going up, down, left, and right, one could conclude there exists a cross pattern. Furthermore, if there is a pattern from all the corners, there is a fair chance that the chessboard exhibits a diagonal pattern. Finally, if there are none of these, it is likely no pattern at all or a pattern that is unable to be detected.
Plotting black and red pieces given a list of their indices:
Plotting black and red pieces given a list of their indices and returns a string of what pattern is detected:
This function, however, isn’t perfect. Since it only checks if a pattern repeats 10 times, it may return false positives for chessboards that don’t have clear patterns on a larger scale. Additionally, this doesn’t cover the totality of all patterns noticeable by humans. In particular, those that would appear as if they were a diagonal pattern may fail simply because the slope of the pattern isn’t 1.
This example in particular appears as if it would have a strong pattern, because it just seems to split the the plane into 8 parts. However, since the slopes between the split sections aren’t 1 or -1, the functions doesn’t detect it as a pattern. Because it isn’t an exact diagonal pattern, the ratio of the red isn’t preserved as the rectangle is scanned, which would prompt the pattern detection to fail.
It is also interesting to note the difference made depending on which piece starts. As shown above, when black moves like a knight and red only moves one diagonally, there is no pattern detected. When the pieces are switched, however, the colors are inverted (unsurprisingly) with a cross pattern detected by the program. Looking at the first graph generated, there are 4 “slices” in which the black pieces reside. In the right and the bottom slice, the slices are less dense compared to the neighboring parts. The function for checking patterns essentially checks if there is a rectangle with width 40 with a pattern that repeats 10 times. Here, the most likely pattern would simple be all of one color, so the function checks if there is a rectangle that is 40 x 10 with the same color in the middle of the graph. The first most likely is just below that cutoff, while the second is.
One might assume that whichever piece starts would have a minimal effect on the outcome of the graph. For example, the colors might be inverted, or the graph might be rotated by a bit. After all, the only change is the starting two places for the pieces, and the eventual pattern should even out to look around the same.
While the example above just inverts the colors when the pieces are switched, most of the graphs and their counterparts are more different and less associated. For the following example, there is a slight change:
The very small change here is that the “spikes” are on opposite sides of the x-axis, and the spikes in the second graph are larger.
However, for the vast majority of patterns, more drastic changes emerge when switching which piece goes first.
Using this function, it is possible to separate the more eccentric patterns by filtering by those with “No Pattern Detected”.
Conclusion
Conclusion
This project walked through the creation of a spiral board, and how one can place an infinite number of black knights on it such that none attack each other. It showed how one could apply the same idea to two colors, black and red, where each color can attack themselves, but not the other. It demonstrated how similar concepts could be applied to many different types of pieces, not just a knight or those in the traditional chess game, and how the patterns created by those can be displayed. This project explored how one could test if there are patterns in these graphs and what one can observe from the patterns identified.
Future Directions
Future Directions
So far, this project has only worked with one or two different colors for the pieces. It would be interesting to consider using several different teams in the same way. Of course, it would be a lot harder to find patterns with more than two different colors, so it would certainly be a challenge, but the results would be more expansive than those of this project.
Currently a lot of the complex functions that plot pieces or identify a pattern take 10 seconds or more. It would be a lot better if it were possible to make these run in a few seconds, or possibly even one. This would allow for a more in-depth search of a wider range of possible pieces, and could connect to the idea of having more than two colors.
References
References
◼
Haran, B. (2026, May 12). Red & black knights (extraordinary result)[Video]. YouTube. https://www.youtube.com/watch?v=UiX4CFIiegM&t=674s
◼
Haran, B. (2026, May 12). Amazing chessboard patterns (extra)[Video]. YouTube. https://www.youtube.com/watch?v=VgmDuBCayPw
◼
Karlsson, J. (n. d.) . Knights . GitHub Pages https://pitouli.github.io/knights/
Acknowledgements
Acknowledgements
First and foremost, I would like to thank my mentor, Nicholas Frieler, for his incredible sense of direction, and his ability to keep forcing me to stay on task. This project would not have been finished without him correcting my mind-boggling errors and my insistence of handling tasks the long and wrong way. I am also incredibly grateful for the most gracious teaching assistant, Eileen Lee, without whom the project might never have been completed. This project prospered heavily from her care, guidance, and an incredible attention to grammar mistakes. Oftentimes, it would appear as if she cared more about this project than I do, and her kindness is impossible to ignore. I am also thankful for my advocate, Adam Millar, who helped organize my various interests into a project that I enjoyed and learned a lot from. Finally, I am also thankful to the program directors: Eryn Gillam, Cyrus Taylor, Rory Foulger, and Megan Davis, as well as to Stephen Wolfram, for ensuring that my research journey was both smooth and enjoyable.
CITE THIS NOTEBOOK
CITE THIS NOTEBOOK
Exploring the placements of colored chess pieces across an infinite spiral chessboard
by Christoffer Lamtan
Wolfram Community, STAFF PICKS, July 9, 2026
https://community.wolfram.com/groups/-/m/t/3753059
by Christoffer Lamtan
Wolfram Community, STAFF PICKS, July 9, 2026
https://community.wolfram.com/groups/-/m/t/3753059