Exploration of data commonly involves statistics and visualization tools which operate best on rectangular arrays of cells containing numbers, strings, and/or dates/times, with minimal missingness. In this project “intelligent”, easy-to-use tool functions will be developed to operate on Microsoft Excel files, isolate and extract rectangular arrays of data, capture accompanying metadata, and help the user understand any missingness that is present.
Some pre-history:
I was playing with computers before the first spreadsheet program (VisiCalc, 1979). I used SuperCalc before Microsoft Excel for Windows, and have stayed with Excel for my spreadsheeting ever since. I started using Mathematica in the early 1990s, and now most of my “computer programming” is in the Wolfram Language (WL). I found myself a student in the 2023 Wolfram Summer School (WSS). I proposed a WSS project to Stephen Wolfram in which I would use WL to automate analysis of data, and he suggested I could focus instead (and simply) on obtaining analyzable data. In particular, as data commonly arrive in spreadsheets, it would make sense to automate finding data in them.
So, the project:
I’ve created spreadsheets and received spreadsheets from others. Many, many Excel spreadsheets have data in them that I’d like to look at using the functionality of WL. Unfortunately, the spreadsheet format (and the modern Excel “workbook” format) is extremely flexible and tolerates a wide variety of styles in its users. If you are like I was before this project, you have little or no knowledge of (or interest in) how Microsoft Excel stores data in the .xlsx files it creates and maintains. But, to appreciate this project, I have to burden you with details.
XLSX “workbook” files have been the default file format for Excel since Excel 2007. These workbook files store information organized into one or more “spreadsheets”, “worksheets”, or simply “sheets”. XLSX files utilize the Office Open XML format. XLS is an older Excel file format which can easily be converted to XLSX if necessary. Other products such as Google Sheets and LibreOffice Calc can also generate XLSX files.
An XLSX file is actually a compressed “ZIP” archive with a file extension of .xlsx instead of .zip. Within the XLSX is a tree of multiple XML files. An XML file is readable as plain text, but only a masochist would do so with a simple text editor. To read XML you want algorithms to help you find what you want.
I first had to learn the functionality of WL Import[ ] (currently in Mathematica version 13.x) when operating on an XLSX file. You can get from it a matrix of data values and a separate matrix of formula strings (which determine values for the cells in which they reside) for each sheet in the XLSX. I decided I wanted more information than that, so I resorted to parsing the XML files for sheets and charts in the XLSX.
I was able to determine from the individual sheet XML files (one XML file for each sheet) that each non-empty cell either had no identified style or had a numbered style. I assumed the style numbers would be explained in the “styles.xml” file but was unable to find reasonable, useful documentation for how cell “style” information (font family, font size, font color, background color, borders) was encoded within this file. The WL Import[ ] function provided only partial information on how cells were formatted.
I knew that sheets sometimes had merged cell groups, and I wanted to find these groups and know the cells merged within them. After some frustrating failures, I determined this was possible by searching within sheet XML files for “XMLElement[mergeCells,” and “XMLElement[mergeCell,”.
I wanted to know what formulas referenced cells, and what formulas generated values without referencing any cells. This latter category seems to me treatable as equivalent to “atomic” or “intrinsic” data (numbers, strings, dates/times in cells).
I wanted to know what cells in the workbook were referenced by formulas. I also wanted to know what cells were referenced by charts within the XLSX. A referenced cell is perhaps more important in a sheet and more likely to contain analyzable data than an unreferenced one.
With all of the above information obtained, I felt ready to find rectangular arrays of “data” within sheets. I created a function to find horizontal or vertical “walls” of empty cells within a sheet, and applied it recursively until I had isolated rectangles (rectangular arrays) of cells not surrounded by any empty cells.
I then took a detour back toward the project idea I’d originally proposed doing during WSS. I created two functions to look at lists of numeric values, which are among the kinds of lists I could get from columns within the rectangles I had isolated. One of these functions calls multiple WL functions for statistical analysis. The other function looks for notable features within the list.
The following multiple sections of WL code are defining a main function and accompanied if necessary by its “helper functions” and some examples of its use. It is my intent to eventually post some of these main functions to the Wolfram Function Repository, albeit then with function names possibly changed and code better documented/explained than simply by usage examples.
I was playing with computers before the first spreadsheet program (VisiCalc, 1979). I used SuperCalc before Microsoft Excel for Windows, and have stayed with Excel for my spreadsheeting ever since. I started using Mathematica in the early 1990s, and now most of my “computer programming” is in the Wolfram Language (WL). I found myself a student in the 2023 Wolfram Summer School (WSS). I proposed a WSS project to Stephen Wolfram in which I would use WL to automate analysis of data, and he suggested I could focus instead (and simply) on obtaining analyzable data. In particular, as data commonly arrive in spreadsheets, it would make sense to automate finding data in them.
So, the project:
I’ve created spreadsheets and received spreadsheets from others. Many, many Excel spreadsheets have data in them that I’d like to look at using the functionality of WL. Unfortunately, the spreadsheet format (and the modern Excel “workbook” format) is extremely flexible and tolerates a wide variety of styles in its users. If you are like I was before this project, you have little or no knowledge of (or interest in) how Microsoft Excel stores data in the .xlsx files it creates and maintains. But, to appreciate this project, I have to burden you with details.
XLSX “workbook” files have been the default file format for Excel since Excel 2007. These workbook files store information organized into one or more “spreadsheets”, “worksheets”, or simply “sheets”. XLSX files utilize the Office Open XML format. XLS is an older Excel file format which can easily be converted to XLSX if necessary. Other products such as Google Sheets and LibreOffice Calc can also generate XLSX files.
An XLSX file is actually a compressed “ZIP” archive with a file extension of .xlsx instead of .zip. Within the XLSX is a tree of multiple XML files. An XML file is readable as plain text, but only a masochist would do so with a simple text editor. To read XML you want algorithms to help you find what you want.
I first had to learn the functionality of WL Import[ ] (currently in Mathematica version 13.x) when operating on an XLSX file. You can get from it a matrix of data values and a separate matrix of formula strings (which determine values for the cells in which they reside) for each sheet in the XLSX. I decided I wanted more information than that, so I resorted to parsing the XML files for sheets and charts in the XLSX.
I was able to determine from the individual sheet XML files (one XML file for each sheet) that each non-empty cell either had no identified style or had a numbered style. I assumed the style numbers would be explained in the “styles.xml” file but was unable to find reasonable, useful documentation for how cell “style” information (font family, font size, font color, background color, borders) was encoded within this file. The WL Import[ ] function provided only partial information on how cells were formatted.
I knew that sheets sometimes had merged cell groups, and I wanted to find these groups and know the cells merged within them. After some frustrating failures, I determined this was possible by searching within sheet XML files for “XMLElement[mergeCells,” and “XMLElement[mergeCell,”.
I wanted to know what formulas referenced cells, and what formulas generated values without referencing any cells. This latter category seems to me treatable as equivalent to “atomic” or “intrinsic” data (numbers, strings, dates/times in cells).
I wanted to know what cells in the workbook were referenced by formulas. I also wanted to know what cells were referenced by charts within the XLSX. A referenced cell is perhaps more important in a sheet and more likely to contain analyzable data than an unreferenced one.
With all of the above information obtained, I felt ready to find rectangular arrays of “data” within sheets. I created a function to find horizontal or vertical “walls” of empty cells within a sheet, and applied it recursively until I had isolated rectangles (rectangular arrays) of cells not surrounded by any empty cells.
I then took a detour back toward the project idea I’d originally proposed doing during WSS. I created two functions to look at lists of numeric values, which are among the kinds of lists I could get from columns within the rectangles I had isolated. One of these functions calls multiple WL functions for statistical analysis. The other function looks for notable features within the list.
The following multiple sections of WL code are defining a main function and accompanied if necessary by its “helper functions” and some examples of its use. It is my intent to eventually post some of these main functions to the Wolfram Function Repository, albeit then with function names possibly changed and code better documented/explained than simply by usage examples.
Microsoft Excel files
Microsoft Excel files
In this work the focus will be on identification and extraction of rectangular arrays (RAs) of data from XLSX format files, such as generated/maintained by Microsoft Excel. XLSX “workbook” files have been the default file format for Excel since Excel 2007. These workbook files store information organized into one or more “spreadsheets”, “worksheets”, or simply “sheets”. XLSX files utilize the Office Open XML format. XLS is an older Excel file format which can easily be converted to XLSX if necessary. Other products such as Google Sheets and LibreOffice Calc can also generate XLSX files.
In this work, it is assumed that the XLSX file is not protected by a password.
In this work, it is assumed that the XLSX file is not protected by a password.
Project Considerations
Project Considerations
Visualization of a sheet
Visualization of a sheet
As part of this project, visualization of a spreadsheet may be valuable, such as to communicate effectively to a user what data arrays have been found within the sheet, and where within the sheet each has been found.
The missing data problem
The missing data problem
In real-world data there is often missingness. An element of data may be simply missing, such as because of measurement failure or because no attempt was made to make a measurement. Regardless of why missingness may be present, in this project one goal is to effectively assist the user in recognizing and understanding its presence and thus how much it might impact discovery. Visualization may be helpful in this regard.
The empty cell problem
The empty cell problem
A rectangular array of data within a sheet may contain within it one or more empty cells. Identifying the proper upper left corner (ULC) and lower right corner (LRC) of the array may be complicated by these empty cells. Empty cells will commonly surround data arrays but not be indicative of missingness, and should not be incorporated into data arrays. In some cases, a sheet may contain a very large number of empty cells and only a small number of non-empty cells. These “unnecessary” empty cells may be removed before a spreadsheet is visualized.
The multiple arrays per sheet problem
The multiple arrays per sheet problem
A sheet may contain more than one rectangular array. These arrays might or might not be separated from each other by rows of empty cells. It may be impossible to tell where one array ends and another array begins.
The merged cell problem
The merged cell problem
Excel permits a row, column, or rectangular group of 2 or more cells to be merged. When a merged cell group is imported into WL, it gets split into its individual cells, and any content that was displayed in the merged cell group is imported into only the top left of the “component” cells cells of the group. The other component cells are imported as if they were empty. This “unmerging” makes it difficult to determine which if any of the cells in the merged area should truly be considered to be empty.
A merged cell group may contain a number, a string, or a date/time just like any single cell in a sheet. Merged cells display in Excel sheets as if their content was spread over the entire merged area, but when formulas refer to one or more cells within the merged area, only the top left cell of the merged area is treated as if it has content.
A merged cell group may contain a number, a string, or a date/time just like any single cell in a sheet. Merged cells display in Excel sheets as if their content was spread over the entire merged area, but when formulas refer to one or more cells within the merged area, only the top left cell of the merged area is treated as if it has content.
The lower right corner problem
The lower right corner problem
A sheet may have a non-empty cell below and/or to the right of all rectangular arrays in the sheet. This non-empty cell should ideally be ignored, and not be included as a cell in any rectangular array.
The opportunity of cell decoration
The opportunity of cell decoration
A sheet may have formatting of cells (colors, fonts, borders, etc.) or comments attached to cells which might, if properly considered, enable better identification of rectangular arrays within the sheet. In this work only limited format information was obtained from worksheets, largely because of inadequate documentation available for the XML file containing or pointing to it. It has been possible to determine if any given cell is formatted similarly to any other cell, but not to understand the individual format elements.
The non-array cell metadata problem
The non-array cell metadata problem
Cells within a sheet will often contain metadata about other cells or groups of cells in the sheet. For example, a rectangular array of numeric data may be surrounded by cells providing column labels and/or row labels for the array (within the sheet). Alternatively, cells near an array of data may describe or name the array. In order to recognize that a sheet contains multiple separable arrays, it may be important to “understand” these nearby cells.
The summary cell problem
The summary cell problem
A rectangular array within a sheet may be surrounded or accompanied by cells summarizing the values in the array, such as array row maximum, array column total, array column length, or array column average. These should ideally be understood to not be part of the array data to be extracted, but rather as providing metadata and hints about what cells comprise the array. Detecting summary cells should in some cases be possible by examination of formulas in cells.
The big data problem
The big data problem
This project is focused on identification of rectangular data arrays within spreadsheets that fit within computer memory, and which can be visualized effectively to communicate to the user what data arrays have been found. If a spreadsheet has more than 1000 rows or more than 1000 columns, it may be difficult to visualize. For example, if a spreadsheet has more than ~100,000 columns and more than ~10,000 columns, it may be very slow to process because it gets managed in virtual rather than physical memory.
The precision problem
The precision problem
Microsoft Excel works with “machine numbers”, not integers. Excel is willing to display numbers without decimal points or fractional parts, but it still does not consider the numbers to be integers. It is not possible to determine the number of significant figures of precision in an Excel number, except possibly by examining the number’s display format.
The bad formula problem
The bad formula problem
Excel will allow a formula in one sheet to refer to cells in another. If a formula with valid syntax in sheet B refers to cells in sheet A which are not considered part of the “dimensions” of sheet A, Excel will not detect or fix this reference to cells not actually in sheet A by properly adjusting the dimensions of sheet A to include the cells referred to by the formula in sheet B.
Formulas may not refer to other cells
Formulas may not refer to other cells
A formula in Excel may refer to data outside the workbook, such as in another workbook (that is, in a separate XLSX file). It may utilize a data connection technology to discover and obtain data from external sources. The value of a formula may change each time the XLSX file is opened or when its sheet is recalculated, such as in the formula “=TODAY()”. Alternatively, a formula in a cell may return a value which does not change with any change in any other cell(s), such as in the formula “=SIN(0.39-3.4/2.6)”. In this work, all formulas which do not reference cells in the current workbook are considered equivalent to static values, rather than as formulas.
summarizeXLSX
summarizeXLSX
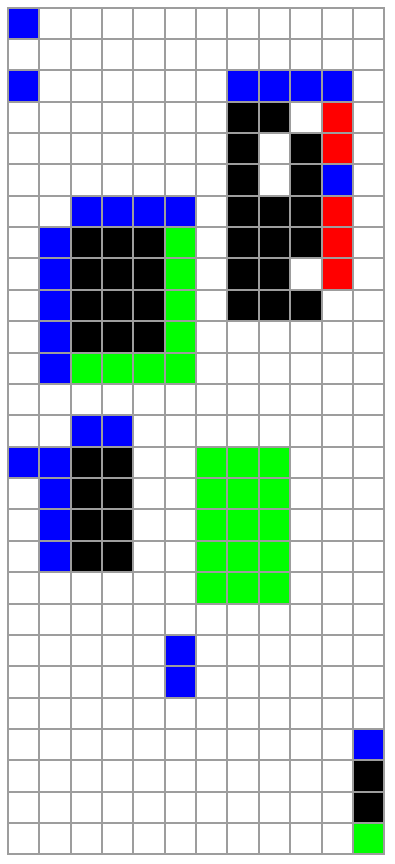
summarizeXLSX takes as its sole argument the name of an XLSX file. It finds sheets and charts within the XLSX, summarizes some information about each sheet, and makes a simple visualization of each sheet. Its results are returned as an Association.
Note that summarizeXLSX cannot work on a file which is open in another application (such as Microsoft Excel) or which is password-protected. Error messages that result in either case may be puzzling.
Note that summarizeXLSX cannot work on a file which is open in another application (such as Microsoft Excel) or which is password-protected. Error messages that result in either case may be puzzling.
In[]:=
summarizeXLSX[xlsxfilename_]:=Module[{xlsxfilesize,xlsxfilenames,sheetnames,nonemptysheetnames,dimensionsassociation,dimensions,numberofcells,sheetxmlfilenames,nonemptysheetxmlfiles,sheetxmlfiles,sheetdata,sheetformulas,numberofformulacells,sheetfirstrows,emptycellcounts,emptycellpercentages,chartxmlfilenames,visualize,visualizations},xlsxfilesize=FileSize[xlsxfilename];xlsxfilenames=Import[xlsxfilename,"ZIP"];sheetnames=Import[xlsxfilename,"Sheets"];dimensionsassociation=Import[xlsxfilename,"Dimensions"];dimensions=dimensionsassociation[#]&/@sheetnames;numberofcells=#[[1]]*#[[2]]&/@dimensions;sheetxmlfilenames=Select[xlsxfilenames,StringMatchQ[#,"xl\\worksheets\\sheet"~~DigitCharacter..~~".xml"]&];sheetxmlfiles=Import[xlsxfilename,{"ZIP",#}]&/@sheetxmlfilenames;nonemptysheetnames=Extract[sheetnames,Position[numberofcells,x_/;x>0]];nonemptysheetxmlfiles=Extract[sheetxmlfiles,Position[numberofcells,x_/;x>0]];sheetdata=Import[xlsxfilename,{"Data",#}]&/@Range[Length[nonemptysheetnames]];sheetformulas=Import[xlsxfilename,{"Formulas",#}]&/@Range[Length[nonemptysheetnames]];numberofformulacells=Count[#,x_/;x!="",{2}]&/@sheetformulas;sheetfirstrows=First/@sheetdata;emptycellcounts=Count[#,"",{2}]&/@sheetdata;emptycellpercentages=If[#[[2]]>0,Round[100.0*#[[1]]/#[[2]],0.1],100.0]&/@Transpose[{emptycellcounts,DeleteCases[numberofcells,0]}];visualize[data_,formulas_]:=Module[{dataheads,formulaheads,arrayplot,arrayplotnomesh,image},dataheads=Map[Switch[Head[#],String,If[#=="",0,1],DateObject,2,Real,3]&,data,{2}];formulaheads=Map[If[#=="",0,4]&,formulas,{2}];(*Print[dataheads];Print[formulaheads];Print[dataheads+formulaheads];*)arrayplot=ArrayPlot[dataheads+formulaheads,ColorRules->{0->White,1->Blue,2->Red,3->Black,7->Green},Mesh->True];arrayplotnomesh=ArrayPlot[dataheads+formulaheads,ColorRules->{0->White,1->Blue,2->Red,3->Black,7->Green},Mesh->False];(*Print[arrayplot];*)If[Length[data]>200||Length[data[[1]]]>200,image=ImageResize[Image[arrayplotnomesh],{2*Length[data[[1]]],2*Length[data]}],arrayplot]];visualizations=visualize[#[[1]],#[[2]]]&/@Transpose[{sheetdata,sheetformulas}];chartxmlfilenames=Select[xlsxfilenames,StringMatchQ[#,"xl\\charts\\chart"~~DigitCharacter..~~".xml"]&];<|"xlsxfilesize"->xlsxfilesize,"xlsxfilenames"->xlsxfilenames,"sheetnames"->sheetnames,"dimensions"->dimensions,"numberofcells"->numberofcells,"emptycellcounts"->emptycellcounts,"emptycellpercentages"->emptycellpercentages,"numberofformulacells"->numberofformulacells,"sheetfirstrows"->sheetfirstrows,"sheetxmlfilenames"->sheetxmlfilenames,"chartxmlfilenames"->chartxmlfilenames,"visualizations"->visualizations(*,"sheetdata"->sheetdata,"sheetformulas"->sheetformulas*)|>]
In[]:=
summarizeXLSX["C:\\Users\\debro\\OneDrive\\Documents\\projecttest1.xlsx"]
Out[]=
xlsxfilesize,xlsxfilenames{[Content_Types].xml,_rels\.rels,xl\workbook.xml,xl\_rels\workbook.xml.rels,xl\worksheets\sheet1.xml,xl\worksheets\sheet2.xml,xl\worksheets\sheet3.xml,xl\theme\theme1.xml,xl\styles.xml,xl\sharedStrings.xml,xl\drawings\vmlDrawing1.vml,xl\worksheets\_rels\sheet1.xml.rels,xl\worksheets\_rels\sheet2.xml.rels,xl\printerSettings\printerSettings1.bin,xl\comments1.xml,xl\printerSettings\printerSettings2.bin,xl\persons\person.xml,xl\calcChain.xml,docProps\core.xml,docProps\app.xml,xl\persons\person3.xml,xl\persons\person1.xml,xl\persons\person0.xml,xl\persons\person2.xml},sheetnames{first sheet,second sheet,Sheet3},dimensions{{27,12},{168,7},{0,0}},numberofcells{324,1176,0},emptycellcounts{230,851},emptycellpercentages{71.,72.4},numberofformulacells{24,162},sheetfirstrows{{spreadsheet to test identification of rectangular data arrays,,,,,,,,,,,},{,,,,,,}},sheetxmlfilenames{xl\worksheets\sheet1.xml,xl\worksheets\sheet2.xml,xl\worksheets\sheet3.xml},chartxmlfilenames{},visualizations
,

extractXLSX
extractXLSX
extractXLSX takes as its sole argument the name of an XLSX file. It returns an Association containing lists of “indicator” matrices, and lists of rectangular data arrays extracted from sheets.
Indicator matrices in the Association include:
sheet data matrices, in which an empty cell is mapped to 0, a string is mapped to 1, a date/time is mapped to a 2, and a number is mapped to 3.
formula matrices, in which a cell without a formula is mapped to an empty string, and a cell with a formula is mapped to “f”
merged cell matrices, in which a cell that is part of a merged cell group is mapped to “m” and all other cells are mapped to an empty string
numbered style matrices, in which nonempty cells with identifiable style numbers are mapped to their style numbers, nonempty cells without style numbers are mapped to 0, and empty cells are mapped to empty strings
formatted data matrices, in which cells with format information captured by WL Import[ ] are numbered the same {1,2,3...} as cells with the same format informaiton, and cells without format information captured are mapped to 0
referencing formula matrices, in which a cell with a formula which references one or more other cells is mapped to “f” and all other cells are mapped to an empty string
referenced cell matrices, in which a cell referenced by one or more formulas or by one or more charts is mapped to “r” and all other cells are mapped to an empty string
The most important outputs in the Association are:
visualizations, pictures of worksheets
before wallsplit, pictures coded so as to indicate how wallsplit should split sheets into arrays
after wallsplit, pictures of arrays found by wallsplit
split array indices, indices (upper right corner, lower left corner) locating where arrays are to be found on sheets
Note that extractXLSX cannot work on a file which is open in another application (such as Microsoft Excel) or which is password-protected. Error messages that result in either case may be puzzling.
Indicator matrices in the Association include:
sheet data matrices, in which an empty cell is mapped to 0, a string is mapped to 1, a date/time is mapped to a 2, and a number is mapped to 3.
formula matrices, in which a cell without a formula is mapped to an empty string, and a cell with a formula is mapped to “f”
merged cell matrices, in which a cell that is part of a merged cell group is mapped to “m” and all other cells are mapped to an empty string
numbered style matrices, in which nonempty cells with identifiable style numbers are mapped to their style numbers, nonempty cells without style numbers are mapped to 0, and empty cells are mapped to empty strings
formatted data matrices, in which cells with format information captured by WL Import[ ] are numbered the same {1,2,3...} as cells with the same format informaiton, and cells without format information captured are mapped to 0
referencing formula matrices, in which a cell with a formula which references one or more other cells is mapped to “f” and all other cells are mapped to an empty string
referenced cell matrices, in which a cell referenced by one or more formulas or by one or more charts is mapped to “r” and all other cells are mapped to an empty string
The most important outputs in the Association are:
visualizations, pictures of worksheets
before wallsplit, pictures coded so as to indicate how wallsplit should split sheets into arrays
after wallsplit, pictures of arrays found by wallsplit
split array indices, indices (upper right corner, lower left corner) locating where arrays are to be found on sheets
Note that extractXLSX cannot work on a file which is open in another application (such as Microsoft Excel) or which is password-protected. Error messages that result in either case may be puzzling.
This function looks for 10+ identical adjacent rows, removes any beyond 10
examineNumericList
examineNumericList
examineNumericList operates on a simple list of numbers, and returns a list of text messages each describing a potentially notable feature of the list. For example:
examineNumericList[{1.,2.,3.,6.,7.,8.,9.,10.}]
produces this output:
{elements are all integers or possibly integers converted to real numbers,elements are in strictly increasing order,element values are all unique,element 3 is sum of elements 1 through 2,all of the elements are multiples of 1.}
examineNumericList[{1.,2.,3.,6.,7.,8.,9.,10.}]
produces this output:
{elements are all integers or possibly integers converted to real numbers,elements are in strictly increasing order,element values are all unique,element 3 is sum of elements 1 through 2,all of the elements are multiples of 1.}
helper functions begin here
this function needs to avoid reporting a repeated value as a total of the element immediately preceding it... a total should be of 2 or more elements to be notable
this function is intended to be applied to lists of numeric values with no missingness
some testing begins here
why didn’t this find 6 as subtotal of 2 and 4? because it looks also at element 1 in the list
whatislist
whatislist
whatislist extracts a numeric list without missingness from a more complex list, salvaging numbers from strings. It then does extensive statistical summarization of the numeric list, returning an Association of its findings.
Among the statistics calculated are the usual things: count, min, max, mean, SD, median, IQR
Less common statistics include: greatest common denominator, number of clusters found, test of fit to a uniform distribution, test of fit to a normal distribution
Among the statistics calculated are the usual things: count, min, max, mean, SD, median, IQR
Less common statistics include: greatest common denominator, number of clusters found, test of fit to a uniform distribution, test of fit to a normal distribution
this function realistically should not be applied to very short lists, such as 5 elements
it does not try to look at the sequence of values in the list, but simply to consider the list a set
it does not try to look at the sequence of values in the list, but simply to consider the list a set
a large p-value means we can’t reject the “null” hypothesis that the input list was drawn from a uniform distribution
a large p-value means we can’t reject the “null” hypothesis that the input list was drawn from a normal distribution
Working Notes
Working Notes
Concluding remarks
Concluding remarks
In this project the focus is on identifying rectangular data arrays in Excel workbook (XLSX) files. The work could be extended to identifying rectangular data arrays in plain text files, Microsoft Word documents, or Portable Document Format (PDF) files, or on web pages.
The most obvious next step after a rectangular data array is found is to examine the array for missingness and/or anomalies. Future work could incorporate functionality to impute missing values and/or to replace anomalies with more plausible values.
At present, Large Language Models (LLMs) limit the number of characters (gathered into “tokens”) which can be effectively presented to them. Despite this, it may be possible to eventually present reasonably large data arrays to LLMs, to have the LLMs separate data from metadata. LLMs may also be useful in summarizing results returned to a user regarding what has been found in an Excel workbook.
The most obvious next step after a rectangular data array is found is to examine the array for missingness and/or anomalies. Future work could incorporate functionality to impute missing values and/or to replace anomalies with more plausible values.
At present, Large Language Models (LLMs) limit the number of characters (gathered into “tokens”) which can be effectively presented to them. Despite this, it may be possible to eventually present reasonably large data arrays to LLMs, to have the LLMs separate data from metadata. LLMs may also be useful in summarizing results returned to a user regarding what has been found in an Excel workbook.
Keywords
Keywords
◼
spreadsheet
◼
data management
◼
automated extraction
◼
visualization
◼
statistical analysis
Acknowledgment
Acknowledgment
Stephen Wolfram suggested that the project would enable progress toward greater automation in data science and automated discovery.
Jofre Espigulé-Pons was mentor to David DeBrota during the Wolfram Summer School.
Robert Nachbar and Mark Greenberg provided valuable assistance with Wolfram Language.
Jofre Espigulé-Pons was mentor to David DeBrota during the Wolfram Summer School.
Robert Nachbar and Mark Greenberg provided valuable assistance with Wolfram Language.
References
References
CITE THIS NOTEBOOK
CITE THIS NOTEBOOK
Extracting rectangular data arrays from Microsoft Excel files
by David DeBrota
Wolfram Community, STAFF PICKS, July 12, 2023
https://community.wolfram.com/groups/-/m/t/2957901
by David DeBrota
Wolfram Community, STAFF PICKS, July 12, 2023
https://community.wolfram.com/groups/-/m/t/2957901