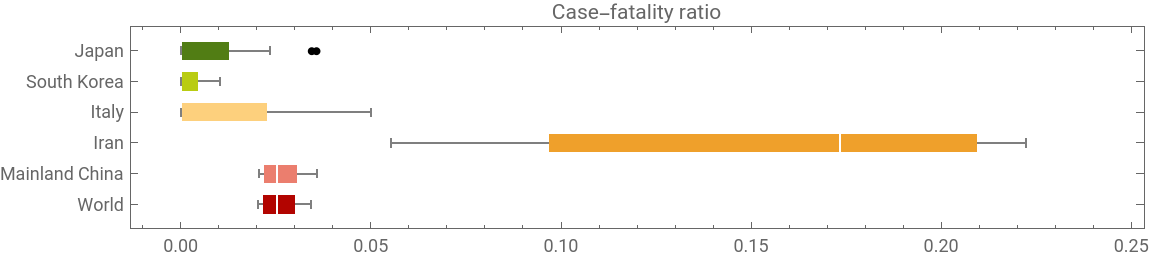
As you may notice, Iran seems to have the greatest data disparity, very likely implying the under-diagnosis problem. Iran has announced a national door-to-door plan to tackle this problem. Before this problem is resolved, I will try to estimate the number of under-diagnosed COVID19 cases in Iran. In this short essay, I will analyse the case-fatality ratio for Iran and compare it with the world, in order to estimate the number of under-diagnosis in Iran.
Collecting data
Collecting data
One can get the COVID19 epidemic data from 2019 Novel Coronavirus COVID-19 (2019-nCoV) Data Repository by Johns Hopkins CSSE, or directly from the Wolfram Data Repository.
In[]:=
{confirmed,deaths,recovered}=Import/@{"https://raw.githubusercontent.com/CSSEGISandData/COVID-19/master/csse_covid_19_data/csse_covid_19_time_series/time_series_19-covid-Confirmed.csv","https://raw.githubusercontent.com/CSSEGISandData/COVID-19/master/csse_covid_19_data/csse_covid_19_time_series/time_series_19-covid-Deaths.csv","https://raw.githubusercontent.com/CSSEGISandData/COVID-19/master/csse_covid_19_data/csse_covid_19_time_series/time_series_19-covid-Recovered.csv"};
In[]:=
dates=confirmed[[1,5;;]];
In[]:=
dt0=Transpose[{confirmed[[2;;,;;2]],confirmed[[2;;,5;;]],recovered[[2;;,5;;]],deaths[[2;;,5;;]]}];
In[]:=
ds0=<|"AdministrativeDivision"#[[1,1]],"Country"#[[1,2]],"ConfirmedCases"TimeSeries[#[[2]],{dates}],"RecoveredCases"TimeSeries[#[[3]],{dates}],"Deaths"TimeSeries[#[[4]],{dates}]|>&/@dt0//Dataset;(*OryoucangetthedatadirectlyfromWDR:*)(*ds0=ResourceData["Epidemic Data for Novel Coronavirus COVID-19"];*)
Last@dates
Out[]=
3/1/20
Visualizations
Visualizations
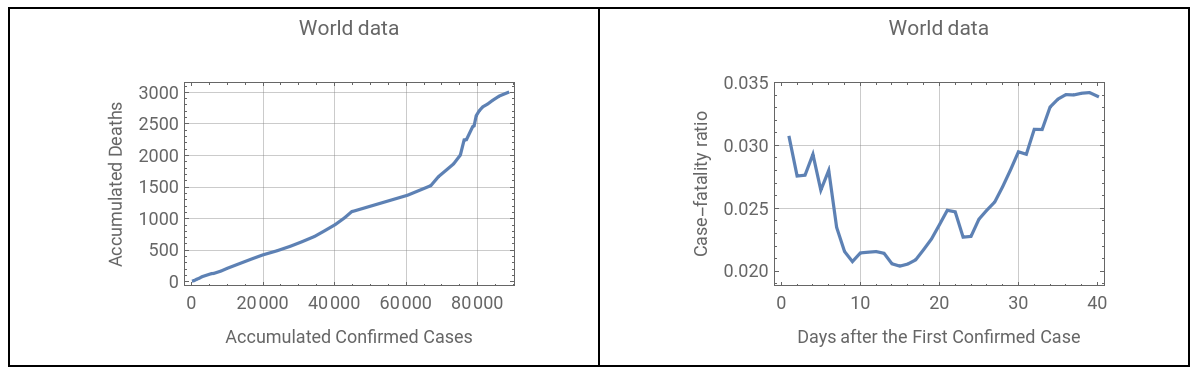
Let’s look at the world data of the death vs confirmed cases and also the daily case-fatality ratio. Note that I am using accumulated data.
GraphicsGrid[{{ListLinePlot[Transpose@Values[#["Values"]&/@Normal[ds0[Total,{"ConfirmedCases","Deaths"}]]],FrameTrue,GridLinesAutomatic,FrameLabel{"Accumulated Confirmed Cases","Accumulated Deaths"},PlotLabel"World data"],ListLinePlot[#2/#1&@@Values[#["Values"]&/@Normal[ds0[Total,{"ConfirmedCases","Deaths"}]]],FrameLabel{"Days after the First Confirmed Case","Case-fatality ratio"},FrameTrue,GridLinesAutomatic,PlotLabel"World data"]}},FrameAll]
Out[]=
Take the top 5 countries with largest number of COVID19 deaths:
In[]:=
top=ds0[GroupBy["Country"],Total,{"ConfirmedCases","Deaths"}][TakeLargestBy[#Deaths["LastValue"]&,5]];
Add the data of all countries and append it to the previous result:
In[]:=
PrependTo[top,"World"Normal@ds0[Total,{"ConfirmedCases","Deaths"}]];
Divide Deaths by ConfirmedCases, to get the case-fatality ratio:
In[]:=
ratioData=#2/#1&@@@Normal[Values[Values[top]]]/.IndeterminateNone//Quiet;
Plot the ratios at a sequence of dates:
Column[{DateListPlot[ratioData,PlotRange{0,.3},GridLinesAutomatic,AspectRatio1/2,FrameLabel{"Days after the First Confirmed Case","Case-fatality ratio"},ImageSize400,PlotLegendsPlaced[Normal[Keys[top]],Above]],DateListPlot[ratioData[[3]],GridLinesAutomatic,AspectRatio1/2,PlotRangeAll,FrameLabel{"Days after the First Confirmed Case","Iran case-fatality ratio"},PlotLabel"Iran's data",ImageSize400]},FrameAll]
Out[]=


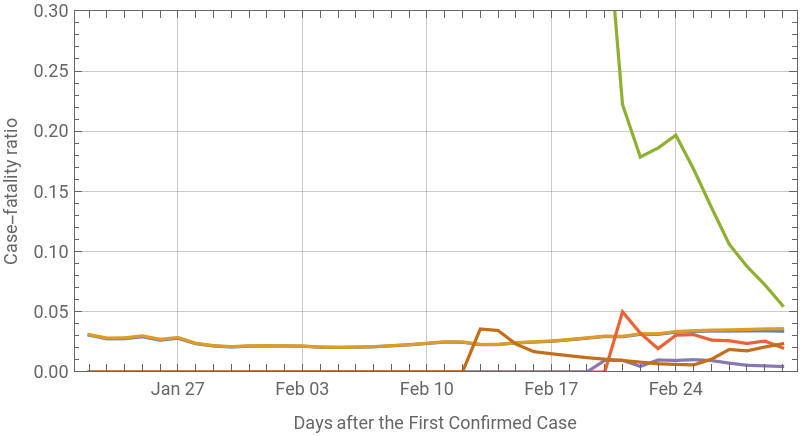
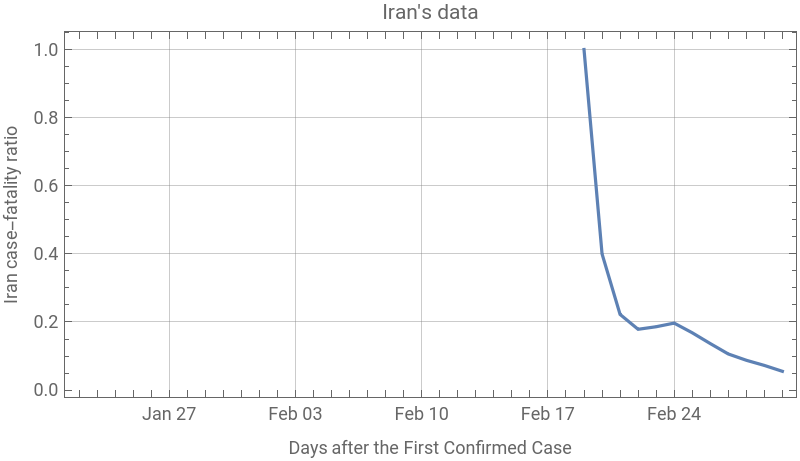
Note that the world data is almost the same as China data, thus overlaying it in above plot. Also, Iran’s initial data started with only deaths, with no prior confirmed cases (look at initial values for Iran).
Box-and-Whisker summary of distributions
Box-and-Whisker summary of distributions
Make a box-and-whisker chart for the case-fatality ratios:
BoxWhiskerChart[N[Values/@ratioData],"Outliers",ChartLabelsPlaced[Normal@Keys[top],Axis],ChartStyle10,BarOriginLeft,PlotRange{{0,.24},All},AspectRatio1/5,ImageSizeLarge,PlotLabel"Case-fatality ratio"]
Out[]=
As you may noticed, the data from Iran is much higher, implying the possibility of undiagnosed of COVID19 in Iran. To find an estimate of under-diagnosis, let us find the empirical distribution of the world case-fatality ratio.
Find the empirical distribution based on the data values of the world:
In[]:=
=EmpiricalDistribution[ratioData[[1]]];
Now I assume that the true COVID19 death data in Iran is more than the reported one by a number called x, and of the ConfirmedCases by a number called y.
Add the corrected numbers to the last day of Iran’s data:
correction=#2/#1&@@(Normal[Query[{#ConfirmedCases["LastValue"],#Deaths["LastValue"]}&]@top["Iran"]]+{y,x})
Out[]=
54+x
978+y
Let us find the possible values of x and y such that Iran’s last ratio is within the 25% and 75% quantile of the world data.
Plot a region within the 25%-75% quantile of the World data:
RegionPlot[Quantile[,0.25]≤correction≤Quantile[,0.75]&&y≥x,{x,0,300},{y,0,10000},FrameLabel{"Unrecorded COVID19 Deaths","Underdiagnosed COVID19 Cases"},GridLinesAutomatic]
Out[]=
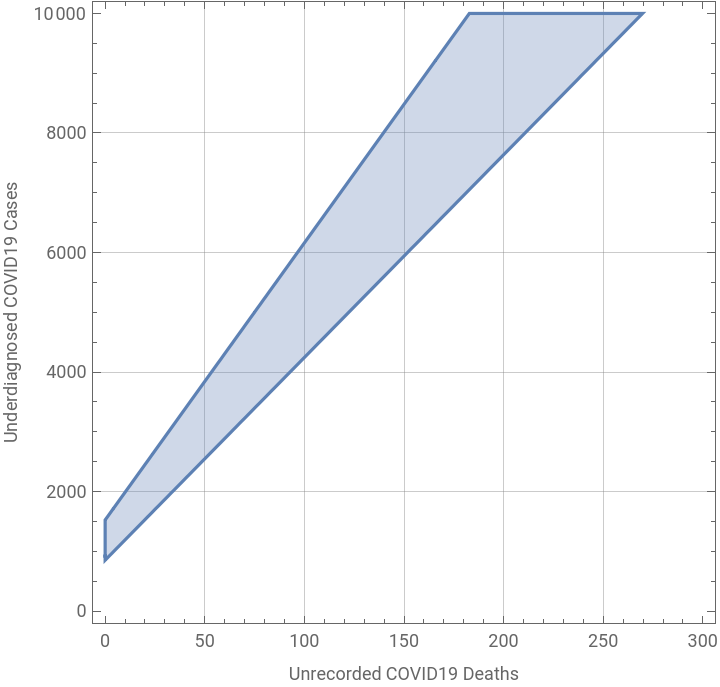
In the best case scenario (i.e., no death only more confirmed cases, ), one finds:
x=0,y>0
bestcase=y/.Solve[Quantile[,0.75]==correction/.x0]//Round//First
Out[]=
853
Concluding remarks
Concluding remarks
As of now (9:50am PT, 3/2/2020), there has been 978 ConfirmedCases and 54 deaths in Iran due to COVID19. In the best case scenario (i.e., no death only more confirmed cases), my analysis shows that there should be 853 more cases, in order to bring Iran’s case-fatality ratio (last data) within the 25%-75% quantile range of the world data. Today, Iran health ministry has announced 523 more cases and 12 more deaths, bringing Iran’s last data to 1501 ConfirmedCases and 66 deaths (note neither datasets I introduced at the beginning have this new data). If I include this new data in my calculation, in the best case scenario, there should be 737 more COVID19 cases in Iran. I welcome any further and more sophisticated statistical analysis, and I hope with Iran’s new initiative, we will have much better data in near future.