FinancialData is a great Mathematica function allowing to get stock related infos of various assets on multiples exchanges. Nonetheless there is not much data related to abundant crypto currencies presents on the current market. The objective is of this post is to present Crypto package allowing to explore current crypto currencies and corresponding historical data on various financial properties as close prices, volumes and market cap.The data source for Crypto package is a public JSON feed provided by https://coinmarketcap.com/The historical data is at day level with last data available at day -1 from current dayThe Crypto is using SQLOperators package presented on previous post.
Load required packages
Load required packages
In[]:=
(*SQLpackage*)CloudImport["https://www.wolframcloud.com/env/damcalrom/Published/SQLOperators.wl"];(*Cryptopackage*)CloudImport["https://www.wolframcloud.com/env/damcalrom/Published/Crypto.wl"];
Demo Crypto package
Demo Crypto package
Functions:
◼
cryptoData[] - gives the list of available crypto currencies in form of SQL table
◼
cryptoData[symbols , start_date , end_date , Options ] - gives the historical data of selected crypto symbols on the period between start_date and end_date .
◼
the default options are {“currency””USD” , “format””Table”} .
◼
currency controls fiat currency in which variables are expressed. (“USD” , “EUR” ...)
◼
format control the output of function. Possible values for now are “Table” ans “TimeSeries”
Get currencies meta data
Get currencies meta data
In[]:=
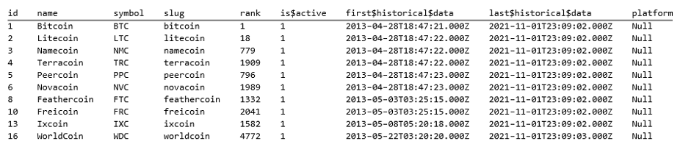
(*getallavailablecryptocurrencies*)cryptoData[]//showTableSQL
Total Rows:6942 Elapsed:0.571111
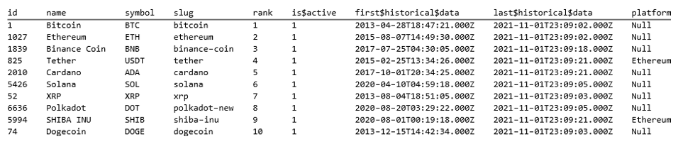
(*orderbyrankandgettop10*)cryptoData[]//orderBySQL[#,{rank}]&//whereSQL[#,rowNumber≤10]&//showTableSQL
Total Rows:10 Elapsed:0.305495
In[]:=
(*filteronalistofsymbols*)symbols={"SHIB","ETH","ADA"};cryptoData[]//whereSQL[#,ContainsAny[{symbol},symbols]]&//showTableSQL
Total Rows:3 Elapsed:0.3344
Out[]=

Get Historical data
Get Historical data
In[]:=
symbols={"SHIB","ETH","ADA","BTC"};(*retursvariablesastimeseries*)cryptoData[symbols,{2021,1},{2021,11},"format""TimeSeries"]//showTableSQL
Total Rows:4 Elapsed:4.97526
Out[]//TableForm=
In[]:=
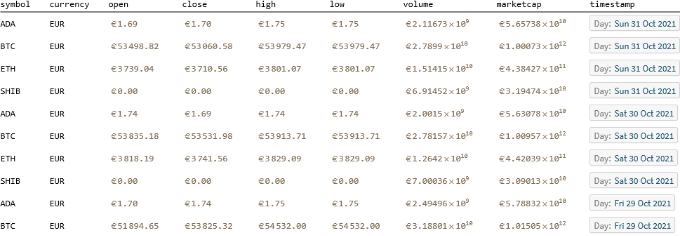
(*retursvariablesasSQLtable*)cryptoData[symbols,{2021,5},{2021,11},"format""Table","currency""EUR"]//orderBySQL[#,{-AbsoluteTime[timestamp]}]&//showTableSQL
Total Rows:736 Elapsed:1.53039
Out[]//TableForm=
(*usingpullSQLwecandoaFinancialDatastyleretrieval*)cryptoData[{"ETH","BTC"},{2021,1,1},{2021,11,1},"format"->"TimeSeries"]//pullSQL[#,{close}]&
Out[]=
TimeSeries,TimeSeries


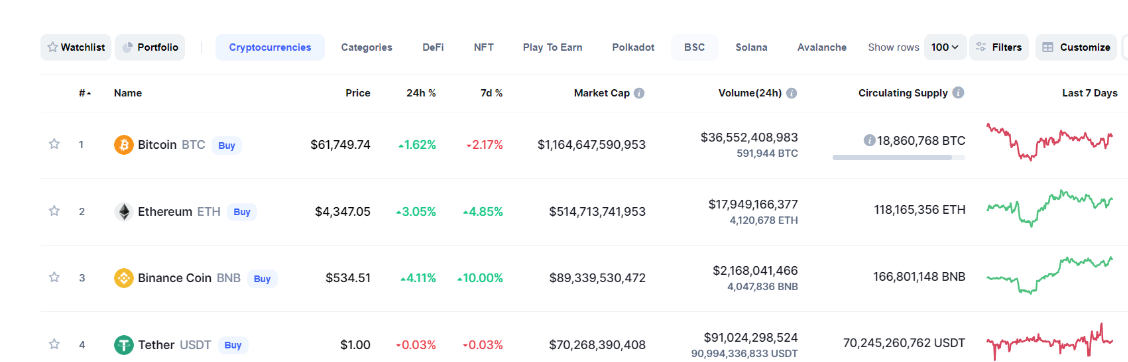
Some playaround... lets simulate the grid from coinmarketcap.com
Some playaround... lets simulate the grid from coinmarketcap.com
In[]:=
(*someformatfunctions*)fmtpercent[x_]:=With[{color=If[x<0,ColorData["Crayola"]["OrangeRed"],ColorData["Crayola"]["Green"]],angle=If[1x<0,45Degree,225Degree]}, Row[Graphics[{color,Rotate[Triangle[],angle]},ImageSize{10,10}]," ", (DecimalForm[Abs[x],{10,2}]//Style[Row[{#," %"}],color,Bold,FontFamily"Arial",FontSize15]&)] ];fmtname[name_,symbol_,img_]:=Row[{ImageResize[img,{20,20}]," ",Style[name,Bold]," ",Style[symbol,Gray]}]//Style[#,FontFamily"Arial",FontSize15]&;fmtcols[x_]:=x//Style[#,FontFamily"Arial",FontSize15]&;(*getfirst10symbolsorderbyrankand*)cryptoData[]//orderBySQL[#,{rank}]&//whereSQL[#,rowNumber<=10]&//selectSQL[#,{rank,symbol,id,name}]&//addColumnsSQL[#,<|"hous24":>cryptoData[{symbol},DatePlus[Today,-3]//DateList,DateList[Today],"format"->"TimeSeries"]// pullSQL[#,{close,volume,marketcap}]&//Flatten, "week":>cryptoData[{symbol},DatePlus[Today,{-1,"Week"}]//DateList,DateList[Today],"format"->"TimeSeries"]// pullSQL[#,{close}]&//Flatten|>]&//addColumnsSQL[#,<|"price":>(hous24[[1]]["LastValue"]), "change24h":>((hous24[[1]]["LastValue"]/hous24[[1]]["FirstValue"]-1)100), "change7d":>((week[[1]]["LastValue"]/week[[1]]["FirstValue"]-1)100), "marketcap":> (hous24[[3]]["LastValue"]), "volume24h":> (hous24[[2]]["LastValue"]), "img":>Import["https://s2.coinmarketcap.com/static/img/coins/64x64/"<>ToString[id]<>".png"] |>]&// addColumnsSQL#,<|"plotweek":>week[[1]]//DateListPlot#,Frame->None,Axes->False,ImageSize->Tiny,AspectRatio->14, PlotStyle->{If[change7d<0,ColorData["Crayola"]["OrangeRed"],ColorData["Crayola"]["Green"]],Thick} &, "label"fmtname[name,symbol,img] |>&//rowMapSQL[#,{change24h,change7d},fmtpercent]&//rowMapSQL[#,{price,marketcap,volume24h,rank},fmtcols]&//selectSQL[#,{rank,label,price,change24h,change7d,marketcap,volume24h,plotweek}]&//showTableSQL
Plots
Plots
Voila ...If you have suggestions or if you enjoy the post don’t hesitate to drop a comment or even better some cryptos change in my empty wallet ;)
Crypto wallet address - 0xbc75Ca2Fde6D0FE1d2bA9f6b4a39f10Eb151dd86
Crypto wallet address - 0xbc75Ca2Fde6D0FE1d2bA9f6b4a39f10Eb151dd86