Abstract
Abstract
“Imagine the global population over the past 500 years.”As you formulated the population growth in your head, you probably “saw” an exponentially increasing curve. Some others may have imagined a Agent Based Model simulation, envisioning individuals as nodes, as those nodes multiply themselves into a larger and larger network. There are different ways to “see” information for us.Did you “hear” anything? Instead of what population growth looks like, what would it sound like? What about the change in voting behavior across generational and geographical differences? This project aims to explore the technique of data sonification; representing various types of data in audio form. Lifestyle under modern technology, exemplified by widespread smart products such as Apple Siri or Amazon Alexa, suggests a need for an alternative data representation format beyond visual. Sufficiently developed, the technology can also help significantly accelerate inclusivity by improving accessibility to data of the visually handicapped. And most compellingly, it simply makes sense to have information readily available in varying formats that can appeal to our intuition through different senses. It makes us one step closer to a more seamlessly technologically integrated lifestyle.Multiple dimensions of auditory information exist, such as pitch, volume, and tone, that can convey information. This project explores mapping the original data onto some of these auditory dimensions. Depending on the environment, new dimensions such as direction (stereo) or spacial coordinate (there is Sound is plotted across the x-y plane rather than linearly) can also be created.What is presented here should be considered preliminary work; for the idea of expanding modes of data representation can (and probably should) be extended as far as data exists to be represented and communicated to others.
In[]:=
TimeSeries2Aud[data_TemporalData]:=AudioGenerator[{"Sin",Rescale[TimeSeriesRescale[data,{0,6}],MinMax[data],{100,1000}]}]TimeSeries2Aud[data_List]:=TimeSeries2Aud[TimeSeries[data]]TimeSeries2Aud[data:{__TemporalData}]:=Mean[MapIndexed[AudioGenerator[{timbres[[Mod[First[#2],Length[timbres],1]]],Rescale[TimeSeriesRescale[#1,{0,6}],MinMax[#1],{100,1000}]}]&,data]]
In[]:=
timbres={"Sin","Triangle","Sawtooth","Square","Pulse","Impulse"}
Out[]=
{Sin,Triangle,Sawtooth,Square,Pulse,Impulse}
In[]:=
Example: exchange rate of 6 different currencies to USD since Sho’s birth
Example: exchange rate of 6 different currencies to USD since Sho’s birth
In[]:=
rates=TimeSeriesResample[FinancialData[#,{DateObject[{1998,5,13}],Today}],"Month"]&/@{"JPY/USD","CAD/USD","INR/USD","ARS/USD","GBP/USD","KRW/USD"};
In[]:=
rates
Out[]=
TimeSeries,TimeSeries,TimeSeries,TimeSeries,TimeSeries,TimeSeries


In[]:=
(*India*)ind=rates[[3]];ListLinePlot[ind]
Out[]=
In[]:=
highs=FindPeaks[ind["ValueList"][[1]]];lows=FindPeaks[-ind["ValueList"][[1]]];lows[[All,2]]*=-1;ListLinePlot[{ind["ValueList"][[1]],highs,lows},Joined{True,False,False},PlotStyle{Automatic,PointSize[.02],PointSize[.02]}]
Out[]=
In[]:=
attacksind=Sound[MapThread[SoundNote[#2,{6/Max[Flatten[{highs[[All,1]],lows[[All,1]]}]]*#1,6/Max[highs[[All,1]]]*#1[[]]+0.01}]&,{Flatten[{highs[[All,1]],lows[[All,1]]}],Flatten[{ConstantArray["G6",Length[highs]],ConstantArray["G2",Length[lows]]}]}]];final=AudioPlay[attacksind];AudioPlay[TimeSeries2Aud[ind]]
Out[]=
AudioStream


In[]:=
ListLinePlot[rates,PlotRangeAll]TimeSeries2Aud[rates]
Out[]=
Out[]=
In[]:=
Histograms?
Histograms?
In[]:=
normal=RandomVariate[NormalDistribution[0,1],200];bimodal=RandomVariate[MixtureDistribution[{0.5,0.5},{NormalDistribution[0,1],NormalDistribution[5,1]}],200];Histogram[normal,Length[BinCounts[normal]]]Histogram[bimodal,Length[BinCounts[bimodal]]]binheights=BinCounts[normal];binheights2=BinCounts[bimodal];maxbin=Max[binheights];maxbin2=Max[binheights2];
Out[]=
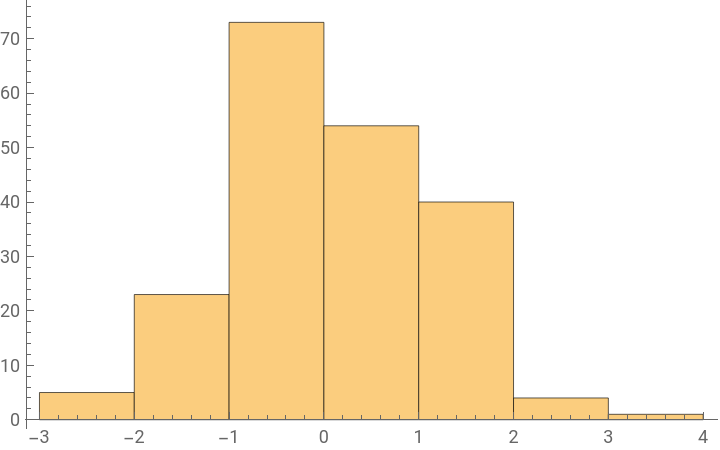
We can hear the two peaks! The distribution seems to sound fairly bimodal.