Right and Equilateral Triangle Ternary Phase Diagrams
Right and Equilateral Triangle Ternary Phase Diagrams

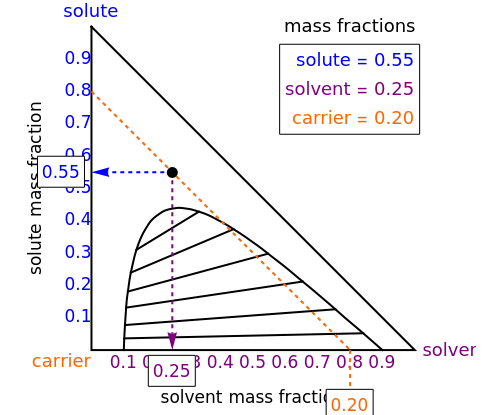
This Demonstration shows two ways to represent a ternary phase diagram. Ternary phase diagrams are used to represent the phase behavior of three-component mixtures. These diagrams are labeled with solute, solvent and carrier as the three components used in liquid-liquid extraction. Click and drag the black dot within the triangle, this represents the composition of the mixture, and each corner of the triangle is a pure component. The mass fractions of each phase present are displayed in a table. Select either a right or an equilateral triangular diagram with buttons. Uncheck "phase envelope" to view diagrams for a completely miscible system. Selecting "phase envelope" represents the type of diagram important for liquid-liquid extraction. The region inside the phase envelope consists of two phases in equilibrium: the raffinate (green) and extract (magenta). Select solute (blue), solvent (purple) or carrier (orange) to view their mass fractions next to their corresponding axis. Select "grid lines" to display a grid on the phase diagram. These diagrams can also be drawn using mole fractions instead of mass fractions.
Details
Details
The screencast video at[1] explains how to use this Demonstration. For another explanation of how to use an equilateral ternary phase diagram, view the screencast at[2].
References
References
[1] Right and Equilateral Ternary Phase Diagrams[Video]. (Sep 1, 2016) http://www.learncheme.com/simulations/materials-science/right-equilateral-triangle-phase-diagrams.
[2] Using a Triangular (Ternary) Phase Diagram[Video]. (Jul 30, 2015) www.youtube.com/watch?v=gGYHXhcKM5s.
External Links
External Links
Permanent Citation
Permanent Citation
Rachael L. Baumann, John L. Falconer
"Right and Equilateral Triangle Ternary Phase Diagrams"
http://demonstrations.wolfram.com/RightAndEquilateralTriangleTernaryPhaseDiagrams/
Wolfram Demonstrations Project
Published: July 31, 2015