The present study investigates how childhood immune tolerance influences antibody selection and the likelihood of autoimmune disease within the adaptive immune system. Using a rule-based computational model implemented in the Wolfram Language, the development of randomly generated antibodies was simulated through childhood immune tolerance and subsequent adult immune responses to explore how immune tolerance affects antibody survival and pathogen recognition. Antibody affinities for multiple self proteins and foreign antigens were calculated using sequence similarity, allowing childhood tolerance decisions and adult immune outcomes to be evaluated for each simulated antibody. The influence of immune tolerance stringency was investigated by varying the tolerance threshold to assess how different levels of immune selectivity affect antibody survival, healthy immune responses, and autoimmune outcomes across repeated simulations. Within the simulated antibody populations, stricter tolerance reduced the frequency of autoimmune responses while also decreasing the number of antibodies that survived to participate in normal immune defense. These findings demonstrate how computational modeling can capture key principles of adaptive immunity while providing an interactive framework for investigating the balance between immune protection and autoimmune risk.
Introduction
Introduction
The adaptive immune system must perform a difficult task throughout life: recognize and eliminate harmful pathogens while avoiding attacks on the body's own healthy tissues. During early immune development, immature immune cells undergo a selection process known as immune tolerance, where cells that bind too strongly to self proteins are removed before they become fully functional. Although this process is highly effective, it is not perfect. Occasionally, self-reactive immune cells escape elimination, increasing the risk of autoimmune disease late in life.Studying immune tolerance experimentally is challenging because millions of immune cells develop continuously and many of these interactions cannot be directly observed. Computational modeling provides an alternative approach by allowing researchers to simulate immune cell development under controlled conditions and systematically modify biological parameters. In this project, I developed a rule-based computational model in the Wolfram Language that simulates antibody generation, childhood immune tolerance, and adult immune responses. Random antibodies are generated and compared against multiple self proteins during childhood. Antibodies with excessive self affinity are removed, while surviving antibodies encounter growing antigens during adulthood. The simulation records whether each antibody produces a healthy immune response, escapes immune tolerance, or contributes to an autoimmune outcome. Interactive visualizations, flow diagrams, and large-scale statistical simulations provide insight into how immune tolerance balances pathogen defense with protection against self-reactivity.
Setup
Setup
Before an immune response can be simulated, antibodies and proteins must first be represented in a form that a computer can manipulate. In living organisms, antibodies recognize complex three-dimensional protein structures through numerous chemical interactions that determine whether binding occurs. Simulating these molecular interactions directly would require advanced structural biology calculations that are beyond the scope of this project. Instead, this model represents each antibody and protein as a sequence of amino acids, allowing their interactions to be studied using computational methods.
Representing proteins as amino acid sequences provides a balance between biological realism and computational efficiency. Although this abstraction does not capture protein folding or molecular geometry, sequence similarity still serves as a useful approximation for estimating antibody binding. This simplified representation makes it possible to generate and compare thousands of antibodies during a single simulation. The following code initializes the core components that will be used throughout the remainder of the notebook.
Representing proteins as amino acid sequences provides a balance between biological realism and computational efficiency. Although this abstraction does not capture protein folding or molecular geometry, sequence similarity still serves as a useful approximation for estimating antibody binding. This simplified representation makes it possible to generate and compare thousands of antibodies during a single simulation. The following code initializes the core components that will be used throughout the remainder of the notebook.
Clear any previous definitions before constructing the immune system model:
In[]:=
ClearAll[aminoAcids,toPeptide,randomPeptide,seqText]
To show what is being simplified, the model first displays a predicted three-dimensional structure of a short peptide sequence. Real antibody binding depends on folded molecular structure, but this project uses amino acid sequence similarity as a coarse-grained approximation so that many antibodies can be simulated efficiently.
examplePeptide=BioSequence["Peptide","ACDEFGHIKL"];exampleMolecule=BioMolecule[examplePeptide,BioMoleculeFoldingMethod->"ESMFold"];BioMoleculePlot3D[exampleMolecule]
Out[]=
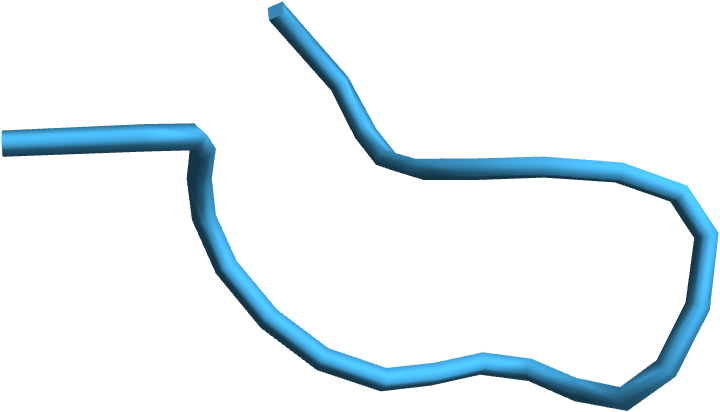
Because full molecular folding calculations are much more complex than the main goal of this project, the rest of the simulation represents antibodies and proteins using BioSequence peptide sequences and compares them with a simplified affinity score.
Display the experimentally determined three-dimensional structure of an antibody:
BioMoleculePlot3D["1HZH"]
Out[]=
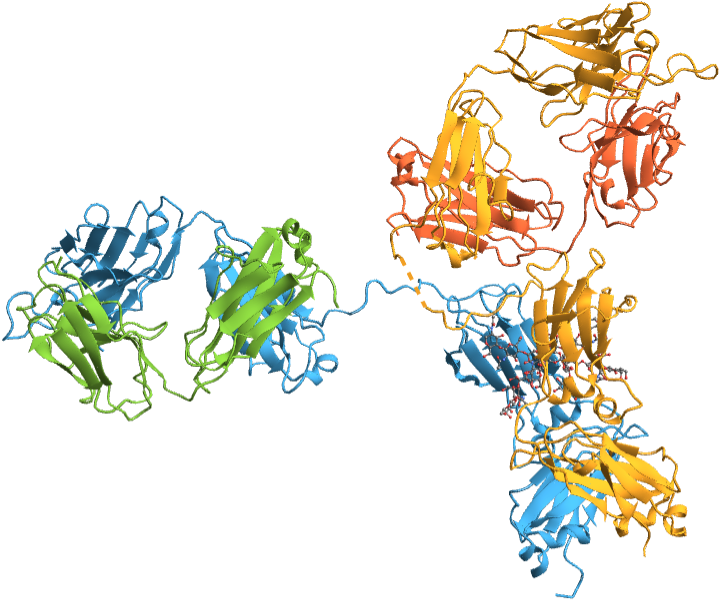
The three-dimensional structure illustrates the complexity of antibody molecules and motivates the simplified sequence-based representation used throughout this computational model.
Define the amino acid alphabet from Wolfram’s built-in peptide alphabet:
In[]:=
aminoAcids=DeleteCases[Keys@Entity["BioSequenceType","Peptide"]["AlphabetRules"],"O"|"U"];
Define a function that converts an amino acid string into a peptide BioSequence object:
In[]:=
toPeptide[seq_String]:=BioSequence["Peptide",seq];
After defining a function to convert amino acid strings into peptide objects, the next function generates random peptide sequences that represent newly created antibodies and proteins during the simulation.
Define a function that generates a random peptide sequence of a specified length:
In[]:=
randomPeptide[n_]:=BioSequence["Peptide",StringJoin[RandomChoice[aminoAcids,n]]];
Create helper functions for generating and reading peptide sequences:
In[]:=
seqText[seq_BioSequence]:=seq["SequenceString"];seqText[seq_String]:=seq
Formatting the Visualizations
Formatting the Visualizations
In this section, I define functions to visualize the immune system simulation clearly and consistently. These formatting tools control the appearance of titles, labels, numerical values, table entries, and color-coded immune outcomes. By defining them once, the later graphics, tables, charts, and animations can use the same visual style throughout the notebook.
Clear any previous definitions of the reusable formatting functions:
In[]:=
Clear[formatText,colorPalette,formatText,num,percentNum,label,value];
Define a reusable function for formatting styled text throughout the notebook:
In[]:=
formatText[t_,c_,op_:{Bold}]:=Style[t,Sequence@@Join[{c},op]];
Define a consistent color palette for antibodies, proteins, and simulation outcomes:
In[]:=
With{self=Purple},colorPalette=;
With the overall visual style established, the remaining helper functions standardize how numerical values and table entries are displayed. Consistent formatting makes affinity scores and simulation results easier to compare throughout the notebook.
Define a function that formats numerical affinity scores:
In[]:=
num[x_]:=NumberForm[x,{3,2}];
Define a function that formats percentages displayed in statistical summaries:
In[]:=
percentNum[x_]:=NumberForm[x,{4,1}];
Define a function for formatting table labels:
In[]:=
label[t_,c_]:=Style[t,c];
Define a function for formatting highlighted table values:
In[]:=
value[t_,c_]:=Style[t,c,Bold];
Measuring Protein Similarity
Measuring Protein Similarity
The immune system relies on antibodies recognizing specific regions of proteins known as antigens. In reality, this recognition depends on complex three-dimensional molecular interactions, including protein folding, electrostatic forces, and the shapes of binding sites. Accurately modeling these molecular interactions normally requires computationally intensive structural biology techniques. To keep the simulation efficient while preserving the underlying biological concepts, this project estimates antibody binding by comparing amino acid sequences instead of full three-dimensional structures.
Sequence similarity serves as a practical substitute for molecular binding because proteins with similar amino acid compositions often share structural characteristics. The model quantifies similarity by measuring the minimum number of amino acid substitutions required to transform one sequence into another. This value is normalized by the sequence length so that every affinity score falls between 0 and 1, where larger values represent stronger similarity. Although simplified, this approach captures the central biological principle that proteins with more similar sequences are generally more likely to interact.
Sequence similarity serves as a practical substitute for molecular binding because proteins with similar amino acid compositions often share structural characteristics. The model quantifies similarity by measuring the minimum number of amino acid substitutions required to transform one sequence into another. This value is normalized by the sequence length so that every affinity score falls between 0 and 1, where larger values represent stronger similarity. Although simplified, this approach captures the central biological principle that proteins with more similar sequences are generally more likely to interact.
Define a function that estimates antibody affinity using normalized edit distance:
In[]:=
affinity[s1_BioSequence,s2_BioSequence]:=Module[{a,b},a=seqText[s1];b=seqText[s2];1-EditDistance[a,b]/Max[StringLength[a],StringLength[b]]];
Compare two identical peptide sequences to demonstrate maximum and minimal affinity respectively:
In[]:=
affinity[toPeptide["ACDEFGHIKL"],toPeptide["ACDEFGHIKL"]]
Out[]=
1
In[]:=
affinity[toPeptide["ACDEFGHIKL"],toPeptide["LMNPQRSTVW"]]
Out[]=
0
Simulating Mutations
Simulating Mutations
Foreign pathogens are not static targets but instead they evolve continuously through random genetic mutations. These mutations can alter the amino acid sequences of surface proteins, allowing viruses and bacteria to evade recognition by previously generated antibodies. Because immune recognition depends on protein structure, even a small number of sequence changes may reduce antibody binding. Incorporating mutation into the simulation therefore allows the model to mimic the constantly changing nature of real pathogens.
Rather than generating entirely unrelated proteins, the simulation introduces a small number of random amino acid substitutions into an existing sequence. This approach preserves the overall length and identity of the protein while creating realistic variation between pathogens. Limiting the number of mutations produces foreign antigens that remain biologically similar to the original sequences but are no longer identical. These mutated sequences are later used to determine whether surviving antibodies can successfully recognize foreign antigens during the adult immune response.
Rather than generating entirely unrelated proteins, the simulation introduces a small number of random amino acid substitutions into an existing sequence. This approach preserves the overall length and identity of the protein while creating realistic variation between pathogens. Limiting the number of mutations produces foreign antigens that remain biologically similar to the original sequences but are no longer identical. These mutated sequences are later used to determine whether surviving antibodies can successfully recognize foreign antigens during the adult immune response.
Define a function that randomly mutates selected amino acids within a protein sequence:
In[]:=
ClearAll[mutateSequence]mutateSequence[seq_BioSequence,changes_]:=Module[{chars,positions,newAA},chars=Characters[seqText[seq]];positions=RandomSample[Range[Length[chars]],changes];Do[newAA=RandomChoice[DeleteCases[aminoAcids,chars[[pos]]]];chars[[pos]]=newAA,{pos,positions}];BioSequence["Peptide",StringJoin[chars]]];
Create an example peptide sequence for mutation:
In[]:=
example=toPeptide["ACDEFGHIKL"];
The example below demonstrates how the mutation function modifies randomly selected amino acids while preserving the overall sequence length. This mimics the small sequence changes that distinguish closely related proteins.
Mutate two randomly selected amino acids within the example sequence:
In[]:=
mutateSequence[example,2]
Out[]=
BioSequence


Modeling Childhood Immune Tolerance
Modeling Childhood Immune Tolerance
Before antibodies are allowed to protect the body, they undergo an important quality-control process known as immune tolerance. During this stage of immune development, newly generated antibodies are exposed to self proteins to determine whether they recognize the body's own tissue. Antibodies that bind too strongly to self proteins are removed before entering circulation, reducing the likelihood of autoimmune disease. This biological screening process is essential for maintaining immune system specificity while minimizing harmful self-reactivity.
The computational model reproduces this process by comparing each newly generated antibody against several representative self proteins. The highest affinity score determines whether the antibody survives or is eliminated according to a predefined tolerance threshold. In addition to generating normal antibodies that successfully pass this screening process, the model also created deliberately self-reactive antibodies to demonstrate how immune tolerance prevents autoimmune responses. These two cases provide contrasting examples that illustrate both successful immune training and failed immune tolerance.
Although immune tolerance is remarkably effective, it cannot eliminate every potentially self-reactive antibody. Biological immune systems must balance two competing objectives: preventing harmful attacks against the body's own tissues while preserving enough antibody diversity to recognize an enormous variety of future pathogens. If immune selection were too strict, many useful antibodies would also be eliminated, weakening protection against infection. On the other hand, if selection were too permissive, more self-reactive antibodies would survive, increasing the likelihood of autoimmune disease. This balance between immune protection and self-tolerance represents one of the important balancing acts explored throughout this project.
Define the affinity threshold used during childhood immune tolerance:
Create a function that generates and evaluates antibodies during childhood immune tolerance:
Display the original and mutated peptide sequences using BioSequencePlot:
This visualization uses Wolfram’s BioSequence tools to show how the peptide sequence changes after mutation while the simulation continues to treat the sequence as a simplified representation of molecular binding.
Generate an example antibody that survives childhood immune training:
Generate an example antibody that is removed during childhood immune training:
Simulating Immune Development
Simulating Immune Development
After establishing the individual components of the model, the next step is to simulate the complete life cycle of a single antibody. During normal immune development, antibodies are first generated randomly and then tested against the body's own proteins during childhood immune tolerance. Antibodies that recognize self proteins too strongly are eliminated to reduce the risk of autoimmune disease. Only antibodies that successfully pass this screening process are allowed to enter the mature immune system.
If an antibody survives childhood tolerance, it enters the adult phase where it encounters a foreign antigen. At this stage, the immune system must distinguish between harmless self molecules and potentially dangerous foreign molecules. A successful immune response occurs when the antibody binds strongly to the foreign antigen without becoming self-reactive. Conversely, antibodies that escape childhood tolerance despite recognizing self proteins may contribute to autoimmune disease.
Because antibody generation is inherently random, every simulation produces a unique immune history. Some antibodies are removed immediately during childhood, while others survive and successfully recognize foreign antigens later in life. A smaller number of self-reactive antibodies may escape tolerance and model the development of autoimmune disease. Running many independent simulations therefore illustrates the probabilistic nature of immune system development rather than a single predetermined outcome.
Define a function that simulates the complete life cycle of a single antibody from childhood immune tolerance through the adult immune response:
Generate one complete immune system simulation:
Summarize One Simulation
Summarize One Simulation
Every simulated antibody generates dozens of values describing its interactions with self proteins and foreign antigens. Organizing these results into tables and charts makes it much easier to follow the biological decisions made throughout an antibody's development. The visualization presents both the childhood tolerance phase and the adult immune response using a consistent layout that highlights the most important information. This allows readers to understand the complete immune history of a single antibody without inspecting the raw data directly.
The childhood summary displays the generated antibody, the representative self proteins, their corresponding affinity scores, and the tolerance threshold used to determine whether the antibody survives immune training. If the antibody successfully enters adulthood, a second summary compares its affinity for the foreign antigen with its affinity for the same self proteins encountered earlier. Bar charts accompany each stage to provide an immediate visual comparison of the calculated affinity scores and emphasize which interactions are strongest. Together, these visualizations transform the simulation output into an interpretable summary that connects the underlying computations with the biological decisions made by the model.
Examining an individual antibody provides insight into how immune tolerance operates at the cellular level. Rather than observing only the final immune outcome, the reader can follow every intermediate calculation that contributes to the antibody's fate. This mirrors experimental immunology, where researchers often analyze individual immune cells before drawing conclusions about larger immune populations. Although one antibody cannot represent the behavior of the entire immune system, studying individual examples makes it easier to understand how sequence similarity, affinity thresholds, and tolerance decisions interact to produce different biological outcomes.
Create the rows displayed in the childhood immune training summary table:
The childhood and adulthood summaries share a similar structure, so separate helper functions are defined to organize the information presented during each stage of the immune response.
Create the rows displayed in the adult immune response summary table:
Clear any previous chart option definitions:
Define reusable formatting options for the childhood self-affinity bar chart:
Because the childhood and adult affinity charts display different biological interactions, each uses its own set of reusable formatting options while maintaining a consistent visual appearance.
Define reusable formatting options for the adult antibody binding affinity bar chart:
Combine the summary tables and affinity charts into a complete visualization of a simulated antibody's immune history:
Display the results of the current immune system simulation:
This simulation demonstrates a self-reactive antibody that escapes normal immune tolerance. The antibody has a maximum self-affinity score of 0.90, which exceeds the tolerance threshold of 0.70, indicating that it binds strongly to one of the body’s own proteins. Although this antibody is classified as self-reactive, the simulation mode allows it to escape childhood immune training and enter adulthood. This example illustrates how failures in immune tolerance can permit potentially harmful antibodies to remain in the mature immune repertoire.
During adulthood, the escaped antibody encounters a foreign antigen with a foreign affinity score of 0.90, indicating strong recognition of the pathogen. However, the antibody also retains a self-affinity score of 0.90 for one of the body’s own proteins. Because the antibody binds strongly to both foreign and self targets, the simulation classifies the outcome as an autoimmune response. This demonstrates that effective pathogen recognition alone is insufficient for healthy immunity if self-reactivity is not eliminated during childhood.
The exact outcome of this simulation depends on the randomly generated antibody sequence and its similarity to both self proteins and the foreign antigen. When the maximum self-affinity remains below the tolerance threshold, the antibody survives childhood and becomes available for future immune responses. If its affinity for the foreign antigen exceeds the activation threshold, the simulation classifies the outcome as a healthy immune response because the antibody successfully recognizes a foreign target without displaying excessive self-reactivity. On the other hand, antibodies that exhibit strong self-affinity are eliminated before adulthood unless they are intentionally allowed to escape tolerance for demonstration purposes.
Visualizing the Decision Pathway
Visualizing the Decision Pathway
Antibody development can be viewed as a sequence of branching decisions, with each stage determining whether the antibody progresses, is removed, or contributed to autoimmune disease. A pathway diagram captures this process in a single visual representation
In this pathway diagram, each box represents a possible stage or decision in the antibody's development. Active boxes and arrows show the route followed by the current antibody, while inactive branches are faded in gray. This makes it easy to compare the path the antibody took with the alternative outcomes it could have followed. The diagram also connects the computational logic of the simulation to the biological process of immune selection.
The pathway diagram emphasizes that immune development is fundamentally a multi-stage decision-making process rather than a single decision. Every antibody begins with random generation, but subsequent decisions determine whether it is removed, survives normally, or contributes to autoimmune disease. Emphasizing inactive branches alongside the active pathway illustrates the alternative biological outcomes that could have occurred under different affinity values. This representation therefore connects the computational decision tree directly to the biological sequence of immune development.
Define some helper functions that will draw decision boxes and the active and inactive arrows between pathway boxes:
Define a function that draws each pathway box and highlights active stages:
Once the pathway stages have been defined, the following function specifies how they are connected. Active branches are highlighted while inactive branches remain visible for comparison.
Define a function that draws active and inactive connections between pathway stages:
Clear a previous function definitions:
Define a function that builds the full pathway followed by one simulated antibody:
The following function assembles the complete decision pathway for an antibody based on the outcome of the simulation. Rather than displaying every possible branch equally, the pathway highlights only the sequence of events followed by the current antibody, making it easier to visualize how childhood tolerance influences adult immune responses.
Display the pathway followed by the current antibody:
The highlighted pathway shows the sequence of events followed by this antibody throughout the simulation. After being generated randomly, the antibody enters childhood immune tolerance and follows the high self-affinity branch because its maximum self-affinity exceeds the tolerance threshold. Instead of being removed, the antibody escapes immune tolerance, progresses into adulthood, and ultimately produces an autoimmune response. The inactive gray branches represent the alternative pathways that could have occurred if the antibody had exhibited lower self-affinity or had been successfully eliminated during childhood.
Animating the Immune Response
Animating the Immune Response
While summary tables and pathway diagrams describe the outcome of a simulation, they do not fully capture the sequence of biological events that occur during immune development. In reality, antibodies encounter multiple self proteins before either surviving or being eliminated, and this process unfolds over time rather than all at once. Animating the simulation allows each stage of immune development to be viewed in chronological order, making the decision process easier to understand. Instead of interpreting isolated values, the reader can watch the antibody progress through childhood tolerance and adulthood as if observing the immune system in action.
The animation follows a complete antibody journey from its random generation through every major decision point in the model. During childhood, the antibody sequentially encounters three representative self proteins, allowing each affinity score to be displayed only after the interaction occurs. If the antibody survives immune tolerance, the animation continues into adulthood, where a foreign antigen is introduced and the antibody's response determines the final immune outcome. The animation concludes with a summary frame that consolidates every important result from the simulation into a single visualization, strengthening the information that we have given so far.
Visualizing immune development over time provides advantages that static tables cannot. Rather than presenting every affinity score simultaneously, the animation gradually reveals each interaction as it occurs, closely mirroring the sequential testing experienced by developing immune cells. This temporal representation reinforces that immune tolerance is not a single event but a series of independent encounters with self proteins. By observing these interactions in order, readers can better understand how early developmental decisions influence every subsequent stage of the immune response.
Clear any previous definitions for the childhood and adult animation helper function.
Generate the animation frames illustrating childhood immune tolerance:
Generate the animation frames illustrating the antibody's response during adulthood:
Generate the final summary frame that reports the antibody's complete immune outcome:
Combine the childhood, adult, and summary frames into a complete interactive animation:
Generate and display an animated simulation of the current antibody's complete immune journey:
The animation illustrates that immune tolerance is a sequential process rather than a single biological event. As the antibody encounters each representative self protein, its affinity is evaluated individually against the tolerance threshold. Only after successfully avoiding excessive binding to every self protein does the antibody progress into adulthood. The final stages of the animation demonstrate the antibody recognizing a foreign antigen and producing its final immune outcome. By visualizing each stage separately, the animation clarifies how multiple developmental decisions collectively determine whether an antibody contributes to healthy immunity or autoimmune disease.
Population-Level Immune Behavior
Population-Level Immune Behavior
Simulate a population of antibodies and summarize their immune outcomes:
Because each antibody develops independently, increasing the repertoire size reduces the influence of random chance on the overall results. Small populations may occasionally produce unusually high or low autoimmune frequencies simply due to sampling variation, whereas larger populations produce increasingly stable estimates of the underlying probabilities within the computational model. This behavior parallels many biological and statistical systems, where larger sample sizes provide more reliable estimates of population characteristics.
Visualizing Repertoire Statistics
Visualizing Repertoire Statistics
Clear any previous definitions before redefining the statistics table:
Create a reusable list containing the rows displayed in the population statistics table:
Construct the population statistics table using the predefined list of rows:
Exploring Repertoire Size
Exploring Repertoire Size
Because the simulation uses random antibody generation, the results from a small population may vary noticeably from one run to another. A sample of 100 antibodies may over represent or under represent certain outcomes simply by chance. Larger samples reduce this random fluctuation and give a more stable estimate of the model's overall behavior. This makes population size an important variable to explore.
The interactive control allows the reader to choose different antibody population sizes and immediately regenerate the summary statistics. As the number of antibodies increases, the percentages for healthy responses, autoimmune responses, and removed antibodies should generally become more consistent. This helps demonstrate why large sample sizes are useful in computational simulations. It also turns the population model into an exploratory tool rather than a fixed calculation.
The interactive control allows the reader to choose different antibody population sizes and immediately regenerate the summary statistics. As the number of antibodies increases, the percentages for healthy responses, autoimmune responses, and removed antibodies should generally become more consistent. This helps demonstrate why large sample sizes are useful in computational simulations. It also turns the population model into an exploratory tool rather than a fixed calculation.
Create an interactive control for changing the number of simulated antibodies:
As the simulated repertoire grows, the percentages of healthy responses, autoimmune outcomes, and removed antibodies gradually stabilize despite continued randomness in individual antibody generation. This behavior demonstrates the Law of Large Numbers, where repeated random events converge toward consistent average values. In biological research, large sample sizes are similarly important for distinguishing genuine biological trends from random experimental variation.
While a single antibody demonstrates one possible developmental pathway, simulating an entire antibody repertoire reveals broader patterns in immune development. For the example of 500 antibodies, 354 (70.8%) produced healthy immune responses, 76 (15.2%) resulted in autoimmune responses after escaping immune tolerance, and 70 (14.0%) were removed during childhood. These results demonstrate that although most randomly generated antibodies successfully contribute to healthy immunity, a measurable fraction become self-reactive, emphasizing the importance of immune tolerance in maintaining immune system safety.
While a single antibody demonstrates one possible developmental pathway, simulating an entire antibody repertoire reveals broader patterns in immune development. For the example of 500 antibodies, 354 (70.8%) produced healthy immune responses, 76 (15.2%) resulted in autoimmune responses after escaping immune tolerance, and 70 (14.0%) were removed during childhood. These results demonstrate that although most randomly generated antibodies successfully contribute to healthy immunity, a measurable fraction become self-reactive, emphasizing the importance of immune tolerance in maintaining immune system safety.
Threshold Sensitivity Experiment
Threshold Sensitivity Experiment
One of the most important parameters in this simulation is the childhood tolerance threshold. This value determines how strongly an antibody may bind to self proteins before it is removed from the immune repertoire. A lower threshold represents a stricter immune system that removes antibodies more aggressively, while a higher threshold allows more antibodies to survive childhood selection. Changing this single parameter therefore affects the balance between immune protection and the risk of self-reactivity.
Rather than evaluating only one threshold, the simulation repeats the repertoire experiment across several threshold values. For each threshold, a new population of antibodies is generated and analyzed using the same computational procedure described previously. The percentages of healthy immune responses, autoimmune responses, and antibodies removed during childhood are recorded for comparison. This transforms the simulation from a single model into a computational experiment that explores how immune strictness influences overall immune behavior.
The tolerance threshold serves as the primary control parameter governing immune selectivity within the model. Lower threshold values require antibodies to exhibit extremely low affinity for self proteins before surviving childhood selection, representing a highly conservative immune system. Higher threshold values relax this requirement, allowing more antibodies to enter adulthood. Because this single parameter influences every antibody generated during the simulation, changing the threshold provides a useful way to investigate how immune stringency shapes the balance between protection and autoimmune risk.
Five thresholds spanning a broad range of immune stringency were selected to illustrate how increasingly strict tolerance affects antibody survival and autoimmune risk.
Define a function that repeats the repertoire simulation across several tolerance thresholds:
Run the threshold experiment using a population of 500 simulated antibodies for each threshold:
Create a table summarizing the threshold experiment results:
Create a line chart showing how immune outcomes change with tolerance threshold:
Display the threshold results as both a table and chart:
Varying the tolerance threshold demonstrates how the strictness of childhood immune selection influences later immune outcomes. Across the tested thresholds (0.5–0.9), the percentage of healthy immune responses remained relatively stable between approximately 67% and 73%, while autoimmune responses varied between 12% and 17%. The percentage of antibodies removed during childhood also changed only modestly, indicating that within this range the immune system maintains a balance between preserving useful antibodies and eliminating self-reactive ones. Rather than producing dramatic changes, these results suggest that the model is relatively robust to moderate adjustments in the tolerance threshold while still demonstrating the trade-off between immune diversity and protection against autoimmunity.
As the tolerance threshold becomes more permissive, a greater proportion of antibodies survive childhood selection and become available for immune defense. However, this increased diversity also raises the probability that self-reactive antibodies remain within the mature immune repertoire, leading to more autoimmune outcomes. On the other hand, increasingly strict tolerance minimizes autoimmune risk but simultaneously removes many antibodies that could otherwise contribute to recognizing foreign pathogens. These results illustrate why evolution likely favors an intermediate level of immune selectivity rather than maximizing either immune diversity or immune safety alone.
As the tolerance threshold becomes more permissive, a greater proportion of antibodies survive childhood selection and become available for immune defense. However, this increased diversity also raises the probability that self-reactive antibodies remain within the mature immune repertoire, leading to more autoimmune outcomes. On the other hand, increasingly strict tolerance minimizes autoimmune risk but simultaneously removes many antibodies that could otherwise contribute to recognizing foreign pathogens. These results illustrate why evolution likely favors an intermediate level of immune selectivity rather than maximizing either immune diversity or immune safety alone.
Final Interactive Immune Simulator
Final Interactive Immune Simulator
The final version combines all components of the project into a single interactive simulation of the immune response. Each run generates a new population of antibodies, classifies them as healthy, autoimmune, or removed according to the model's rules, and tracks the resulting populations over time. Because the process includes randomness, every simulation produces slightly different outcomes, reflecting the probabilistic nature of antibody development.
The interactive controls allow the user to generate new simulations, reset the model, view the antibody pathway diagram, and observe cumulative population statistics. Rather than demonstrating only one fixed example, the completed model serves as an exploratory tool that helps users investigate how immune tolerance and random variation influence the composition of the immune system.
Unlike the earlier examples, which demonstrated fixed simulations, the completed interface allows users to investigate immune behavior interactively. Each newly generated antibody follows its own developmental pathway while simultaneously contributing to cumulative population statistics. This combination of individual simulations and population analysis transforms the notebook from a static demonstration into an exploratory computational model capable of illustrating both microscopic immune decision and macroscopic immune trends.
Create a helper function that summarizes cumulative antibody simulations in a table and charts:
Launch the final interactive immune system simulator:
Because every simulation uses newly generated antibody sequences, repeated executions continually produce different immune histories while preserving the same underlying biological rules. This variability emphasizes an important property of computational biology models: randomness influences individual outcomes, but repeated simulations reveal stable biological principles that emerge across large populations.
Model Limitations
Model Limitations
Although the model captures several fundamental principles of adaptive immunity, it intentionally simplifies many aspects of real immune biology. Antibody binding is estimated using amino acid sequence similarity rather than three-dimensional molecular structure, allowing affinity calculations to remain computationally efficient. In reality, antibody recognition depends on protein folding, binding-site geometry, electrostatic interactions, and numerous biochemical factors that cannot be represented by sequence similarity alone.
Similarly, the simulation models immune tolerance using only a small number of representative self proteins, whereas developing immune cells in living organisms encounter a far greater diversity of self antigens. Additional biological processes, including affinity maturation, clonal expansion, T-cell regulation, cytokine signaling, immune memory, and antigen presentation, are also omitted. Despite these simplifications, the model successfully reproduces the essential biological balance between maintaining immune diversity and preventing autoimmune disease, making it an effective educational and computational framework for exploring immune tolerance.
Similarly, the simulation models immune tolerance using only a small number of representative self proteins, whereas developing immune cells in living organisms encounter a far greater diversity of self antigens. Additional biological processes, including affinity maturation, clonal expansion, T-cell regulation, cytokine signaling, immune memory, and antigen presentation, are also omitted. Despite these simplifications, the model successfully reproduces the essential biological balance between maintaining immune diversity and preventing autoimmune disease, making it an effective educational and computational framework for exploring immune tolerance.
Conclusion
Conclusion
This project demonstrates how computational modeling can be used to investigate the biological principles underlying immune tolerance and antibody selection. By representing antibodies and proteins as amino acid sequences and simulating childhood immune training followed by adult immune responses, the model illustrates how immune tolerance balances protection against foreign pathogens with the prevention of autoimmune disease. Population-level simulations consistently showed that increasing the stringency of immune tolerance reduced autoimmune responses while also decreasing the number of antibodies that survived to participate in normal immune defense, emphasizing a fundamental trade-off within the adaptive immune system.
This model captures the core principles of immune tolerance in an accessible and interactive framework. The combination of rule-based programming, statistical analysis, and dynamic visualizations demonstrates how computational approaches can be used to investigate biological systems that are difficult to study experimentally. Beyond illustrating key immunological concepts, the completed simulator serves as an interactive educational platform for exploring immune development and provides a flexible computational framework that can be extended to investigate increasingly realistic models of adaptive immunity, including affinity maturation, pathogen evolution, immune memory, and additional regulatory mechanisms.
This model captures the core principles of immune tolerance in an accessible and interactive framework. The combination of rule-based programming, statistical analysis, and dynamic visualizations demonstrates how computational approaches can be used to investigate biological systems that are difficult to study experimentally. Beyond illustrating key immunological concepts, the completed simulator serves as an interactive educational platform for exploring immune development and provides a flexible computational framework that can be extended to investigate increasingly realistic models of adaptive immunity, including affinity maturation, pathogen evolution, immune memory, and additional regulatory mechanisms.
Acknowledgements
Acknowledgements
First, I would like to thank Stephen Wolfram for making this program possible and for creating such an incredible opportunity to explore computational science.
I would also like to thank my mentor, Rafael, for his guidance, encouragement, and support throughout this project. In addition, I am grateful to the program directors, Rory, Eryn, Megan, and Cyrus, for organizing such a wonderful program and creating an engaging learning environment.
I would also like to thank my advocate and mentor groups for their encouragement throughout the program. A special thank you goes to my advocate, Peter, for helping me take my first steps on this project, and to my TA, Divya, for her guidance, positivity, and for making the experience both enjoyable and memorable.
Finally, I would like to thank my TA group: Shaivi, Nupur, Ellie, Morgan, Ava, and Gracelyn. Your friendship, support, and encouragement made this experience far more enjoyable than I could have imagined. I truly appreciate the time we spent learning together, and I wish each of you the very best in your future endeavors.
References
References
◼
Alberts, B., Johnson, A., & Lewis, J. (2002). The Adaptive Immune System. Nih.Gov; Garland Science. https://www.ncbi.nlm.nih.gov/books/NBK21070/
◼
Janeway, C. A., Travers, P., Walport, M., & Shlomchik, M. J. (2018). Immunobiology: The Immune System in Health and Disease. 5th edition. Nih.Gov; Garland Science. https://www.ncbi.nlm.nih.gov/books/NBK27090/
◼
Kosloff, M., & Kolodny, R. (2007). Sequence-similar, structure-dissimilar protein pairs in the PDB. Proteins: Structure, Function, and Bioinformatics, 71(2), 891–902. https://doi.org/10.1002/prot.21770
◼
National Institute of Allergy and Infectious Diseases. (2014). Disorders of the Immune System | NIH: National Institute of Allergy and Infectious Diseases. Nih.Gov. https://www.niaid.nih.gov/research/immune-system-disorders
◼
Wang, Z., Li, J., Wang, M., Yu, Y., Lu, Y., Xia, Q., & Wei, P. (2025). Reconciling specificity and non-specificity in antibody binding: An energy landscape framework for immunology education [Review of Reconciling specificity and non-specificity in antibody binding: An energy landscape framework for immunology education]. Frontiers in Immunology, 16. https://doi.org/10.3389/fimmu.2025.1650722
CITE THIS NOTEBOOK
CITE THIS NOTEBOOK
Modeling immune tolerance: simulating antibody selection and autoimmune disease
by Shrika Aluru
Wolfram Community, STAFF PICKS, July 9, 2026
https://community.wolfram.com/groups/-/m/t/3750290
by Shrika Aluru
Wolfram Community, STAFF PICKS, July 9, 2026
https://community.wolfram.com/groups/-/m/t/3750290