Contour Plots of the Zeta Function
Contour Plots of the Zeta Function


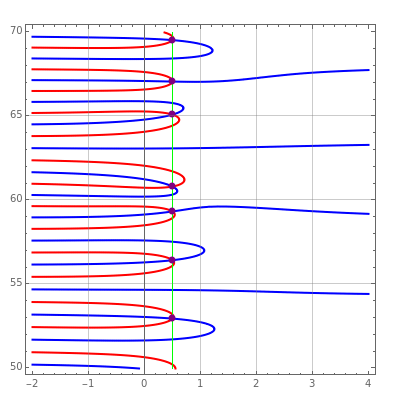
The level curves at zero of the real and imaginary parts of the Riemann zeta function show their intersections on the real line from to . The Riemann Hypothesis states that all of the zeros (other than those at the even negative integers) occur on this critical line.
s=1/2+yi
y
y+Δy
External Links
External Links
Permanent Citation
Permanent Citation
Bill Collins
"Contour Plots of the Zeta Function"
http://demonstrations.wolfram.com/ContourPlotsOfTheZetaFunction/
Wolfram Demonstrations Project
Published: March 7, 2011