Proteins are composed of amino acids which form secondary structures with α-helices and β-sheets. These proteins do not contain all of the standard amino acids at the same frequency. So, it is interesting to analyze the abundance of amino acids in a protein, as well as the presence of secondary structures like the α-helix and β-sheet, because different proteins have different propensities to form secondary structures.
Downloading protein structure
In order to analyze the amino acid abundance in proteins, we need coordinate files of protein structure that can be downloaded using the four-letter PDB ID with this function written by Jason Biggs at Wolfram Research:
Code to download protein structure coordinate files
Code to download protein structure coordinate files
Downloading protein coordinate file
Downloading protein coordinate file
Download the protein structure for the protein with the PDB ID "7kag" to be used for analysis. The downloaded file is stored in FileNameJoin[{$UserDocumentsDirectory,”Wolfram”,”CrystalStructures”}]:
In[]:=
pdbid="7kag";protein=proteinStructure[pdbid];
Getting residue information
Extract the residue information:
In[]:=
residues=protein["Residues"]
Amino acid abundance in a protein
To get total amino acid abundance, we don't need the chain information:
In[]:=
residues=Flatten@protein["Residues"]
Out[]=
{Ala,Pro,Thr,Lys,Val,Thr,Phe,Gly,Asp,Asp,Thr,Val,Ile,Glu,Val,Gln,Gly,Tyr,Lys,Ser,Val,Asn,Ile,Thr,Phe,Glu,Leu,Asp,Glu,Arg,Ile,Asp,Lys,Val,Leu,Asn,Glu,Lys,Cys,Ser,Ala,Tyr,Thr,Val,Glu,Leu,Gly,Thr,Glu,Val,Asn,Glu,Phe,Ala,Cys,Val,Val,Ala,Asp,Ala,Val,Ile,Lys,Thr,Leu,Gln,Pro,Val,Ser,Glu,Leu,Leu,Thr,Pro,Leu,Gly,Ile,Asp,Leu,Asp,Glu,Trp,Ser,Met,Ala,Thr,Tyr,Tyr,Leu,Phe,Asp,Glu,Ser,Gly,Glu,Phe,Lys,Leu,Ala,Ser,His,Met,Tyr,Cys,Ser,Phe,Tyr,Pro,Pro,Asp,Glu,Ala,Pro,Thr,Lys,Val,Thr,Phe,Gly,Asp,Asp,Thr,Val,Ile,Glu,Val,Gln,Gly,Tyr,Lys,Ser,Val,Asn,Ile,Thr,Phe,Glu,Leu,Asp,Glu,Arg,Ile,Asp,Lys,Val,Leu,Asn,Glu,Lys,Cys,Ser,Ala,Tyr,Thr,Val,Glu,Leu,Gly,Thr,Glu,Val,Asn,Glu,Phe,Ala,Cys,Val,Val,Ala,Asp,Ala,Val,Ile,Lys,Thr,Leu,Gln,Pro,Val,Ser,Glu,Leu,Leu,Thr,Pro,Leu,Gly,Ile,Asp,Leu,Asp,Glu,Trp,Ser,Met,Ala,Thr,Tyr,Tyr,Leu,Phe,Asp,Glu,Ser,Gly,Glu,Phe,Lys,Leu,Ala,Ser,His,Met,Tyr,Cys,Ser,Phe,Tyr,Pro,Pro,Asp,Glu}
Compute the total number of residues for normalization purposes:
In[]:=
totresidues=Length@residues
Out[]=
222
Count the number of times individual amino acids are present in the protein:
In[]:=
assoc=Counts[Flatten[residues]]
Out[]=
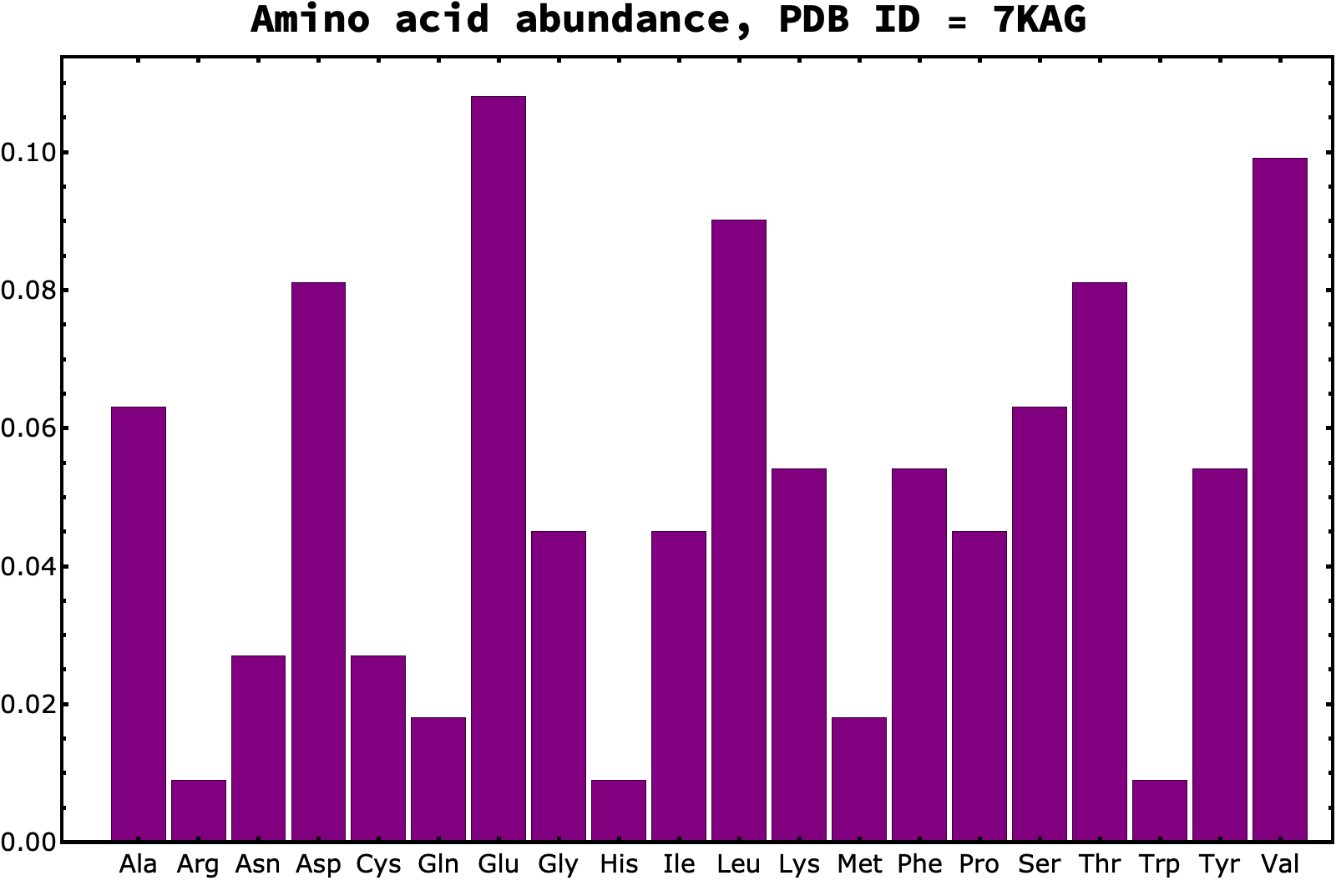
Ala14,Pro10,Thr18,Lys12,Val22,Phe12,Gly10,Asp18,Ile10,Glu24,Gln4,Tyr12,Ser14,Asn6,Leu20,Arg2,Cys6,Trp2,Met4,His2
Define the list of amino acids being considered for our analysis:
In[]:=
AminoAcidList={"Ala","Arg","Asn","Asp","Cys","Gln","Glu","Gly","His","Ile","Leu","Lys","Met","Phe","Pro","Ser","Thr","Trp","Tyr","Val"}
Define a list of frequencies of individual amino acids in the protein:
In[]:=
bc=Lookup[assoc,AminoAcidList,0]
Out[]=
{14,2,6,18,6,4,24,10,2,10,20,12,4,12,10,14,18,2,12,22}
Finally, plot the normalized abundance of amino acids:
In[]:=
Labeled[BarChart[bc/totresidues,ChartLabels->AminoAcidList,ImageSize->800,BaseStyle->"Label",ChartStyle->Directive[Purple,Opacity[1]],Frame->True,FrameStyle->Directive[Black,Thick],FrameTicksStyle->{Directive[Black,15],Directive[Black,15]}],Style[StringJoin["Amino acid abundance, PDB ID = ",ToUpperCase@pdbid],Bold,Large],Top]
Out[]=
Function for abundance of amino acids
Function for abundance of amino acids
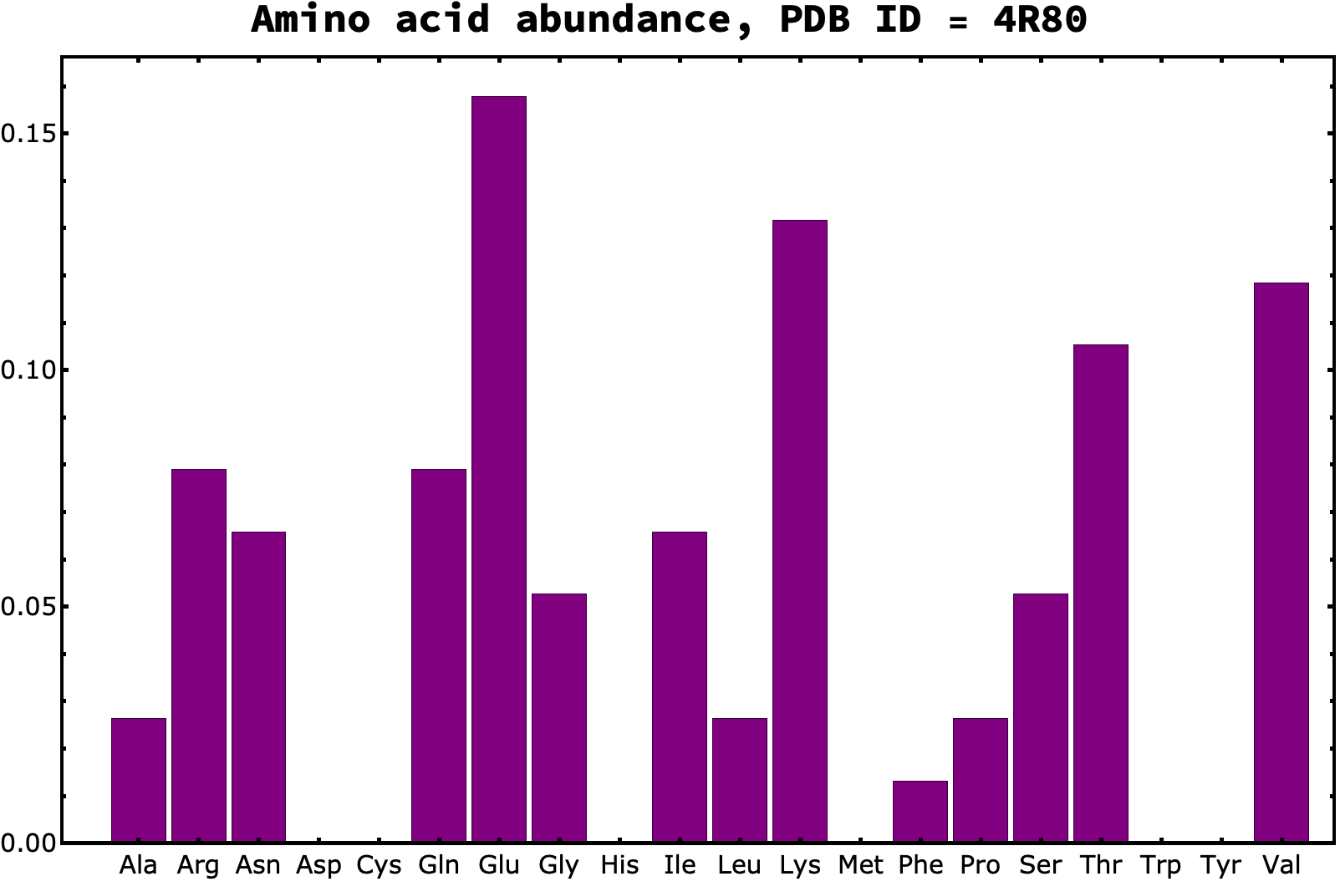
Single protein
Single protein
In[]:=
AminoAcidAbundance["4r80"]
Out[]=
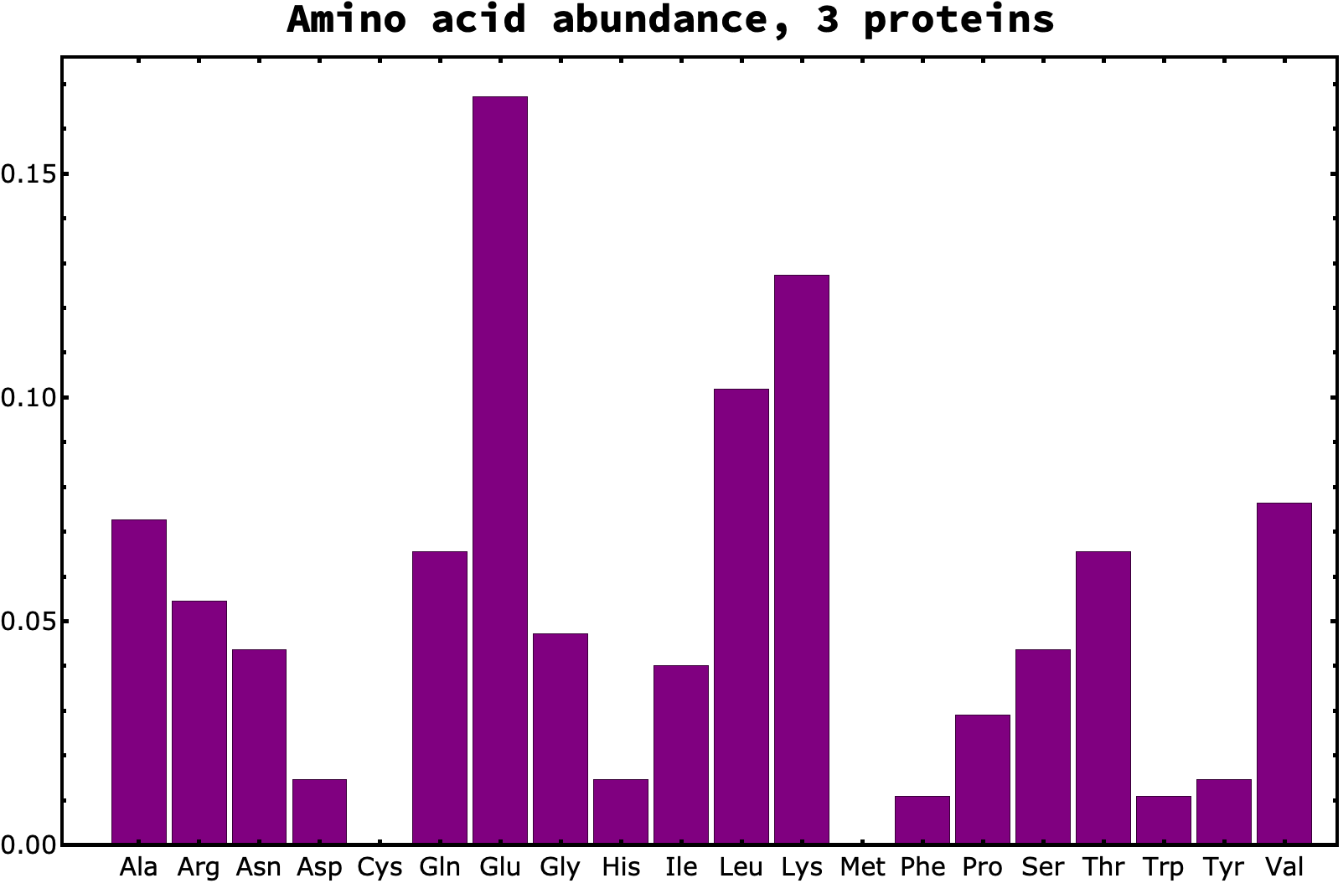
List of proteins
List of proteins
In[]:=
AminoAcidAbundance[{"4r80","1ppt","1cos"}]
Out[]=
Amino acid abundance in α-helix, β-sheet and backbone (neither helix nor sheet) of a protein
For this, apart from residue information, we also need information on which residues of the protein belongs to α-helix or β-sheet or backbone (neither helix nor sheet). We start with the our protein:
In[]:=
pdbid="7kag";protein=proteinStructure[pdbid];
Extract information about secondary structure:
In[]:=
ss=protein@"SecondaryStructure"
Out[]=
{Helix{{{31,39},{49,66},{68,73},{78,83}},{{31,39},{49,66},{78,83}}},Sheet{{{3,6},{12,15},{18,25},{41,45},{88,90},{101,105}},{{3,6},{12,15},{18,25},{41,45},{88,90},{101,105}}},Turn{}}
Extract residue information as well:
In[]:=
res=protein@"Residues"
Get the total number of residues for the protein for normalization:
Get the names of the chains in the protein:
Here is a function for extracting information about where the α-helices and β-sheets are in a protein:
Using this function, we can get the secondary structure information:
We now know where the helices and sheets are in the protein. The steps above can be wrapped in a function to get which amino acids belong to sheets, helix or backbone (neither helix nor sheet) respectively, as well as how many residues in total are present in the protein:
Let us apply the function:
So the amino acids that are present in β-sheets, α-helices and backbone that is neither sheets nor helices are:
This is all we need to get the amino acid abundance in α-helix, β-sheet and backbone of a protein:
Applying AminoAcidAbundanceSecondaryStructure
Applying AminoAcidAbundanceSecondaryStructure
Let us plot another protein:
Applying AminoAcidAbundanceSecondaryStructureProteinList
Applying AminoAcidAbundanceSecondaryStructureProteinList
Let us see how it works:
Analyze with a large list of proteins to see which amino acids are most likely to form α-helix and β-sheets.
Analyze with a large list of proteins to see which amino acids are most likely to form α-helix and β-sheets.
Acknowledgement
I would like to thank Jason Biggs for guidance and also for providing the proteinStructure function and Jan Mangaldan for useful suggestions.
Contact
◼
soutick2010@gmail.com
◼
souticks@wolfram.com