In[]:=
s=
;t=Range[-1,1,0.5];
1 | 2 | 3 |
4 | 5 | 6 |
7 | 8 | 9 |
10 | 11 | 12 |
13 | 14 | 15 |
In[]:=
ListPlot[s,{t}]

Out[]=
ListPlot[{{1,2,3},{4,5,6},{7,8,9},{10,11,12},{13,14,15}},{{-1.,-0.5,0.,0.5,1.}}]
In[]:=
data=TemporalData[s,{t}]
Out[]=
TemporalData


In[]:=
ListPlot[data]
Out[]=
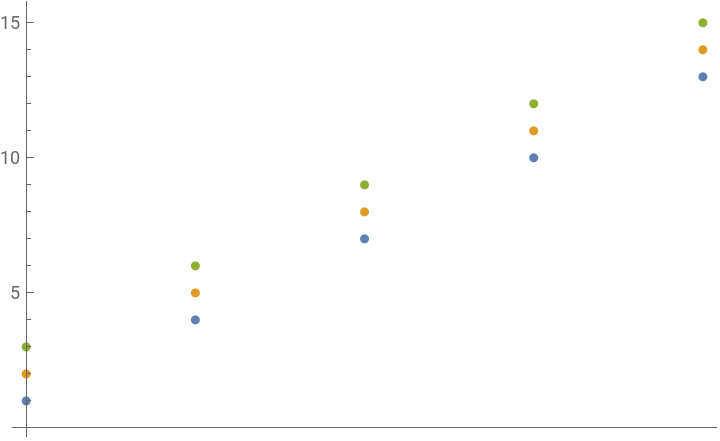
I don’t need the x axis like time, I need them to be normal x axis, How to do that?