The 2019 Beresheet lunar crash marked a significant event in recent space exploration. My project aims to analyze and model the factors that contributed to it. To simulate the events leading up to the accident, I used telemetry data from the last 3 minutes of the lander’s transmissions and images of the crater formed by the impact. These analyses provided insight into the technical challenges faced during a landing attempt on a celestial body. Apart from the crash, this project also analyzed landing locations in the Mare Serenitatis Crater near Beresheet. By examining the available information and employing various computational modeling techniques, I aim to contribute to the collective knowledge of lunar landing missions for the future.
Introduction
Introduction
The investigation of the Beresheet lunar crash was a complex yet exciting problem that required a variety of mathematical and physical principles to unravel. My project originated from a 2019 essay (Wolfram.) published by Stephen Wolfram regarding the same lunar crash. Stephen’s original work consisted of image analysis and physical modeling of the collision. In my project, I hoped to continue this work and provide further insight into the Beresheet accident.
To model the formation of the craters, I analyzed photos of the surface of the moon before and after the Beresheet crash. I then calculated the characteristics of the impact and used preexisting models to recreate and predict the topology of the resulting crater. By examining the energy fluctuations within the telemetry data, I was able to study the kinetic and potential energies involved, as well as relate them to the lander’s consumption of fuel. Finally, by modeling the forces generated by the lunar lander’s thrusters and constructing trajectory plots, I was able to gain a more complete understanding of the spacecraft’s motion.
Analyzing the Impact Crater
Analyzing the Impact Crater
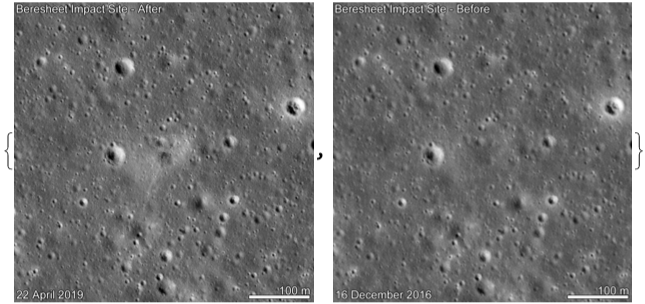
By comparing NASA images from 2016 and 2019 at the crash location, I could precisely see the crater formed by Beresheet’s impact. Through image processing, I attempted to ascertain the shape of the impact crater.
Import the images in grayscale:
In[]:=
{rawImageAfter,rawImageBefore}=ColorConvert[#,"Grayscale"]&/@Import["https://www.nasa.gov/sites/default/files/styles/full_width/public/thumbnails/image/content_beresheetimpact_1100px.gif?itok=5YzCoiKv"]
Out[]=
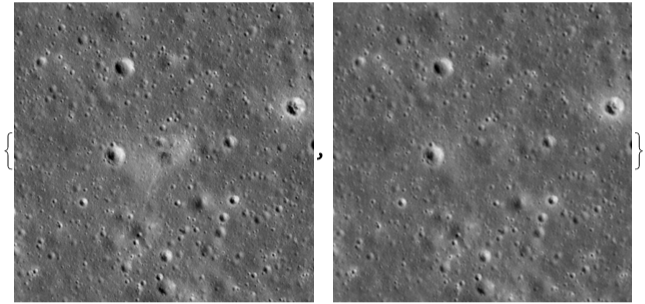
Remove the text on the corners of the image:
In[]:=
{imageAfter,imageBefore}=Inpaint[#,Dilation[Binarize[#,{1,1}],5]]&/@{rawImageAfter,rawImageBefore}
Out[]=
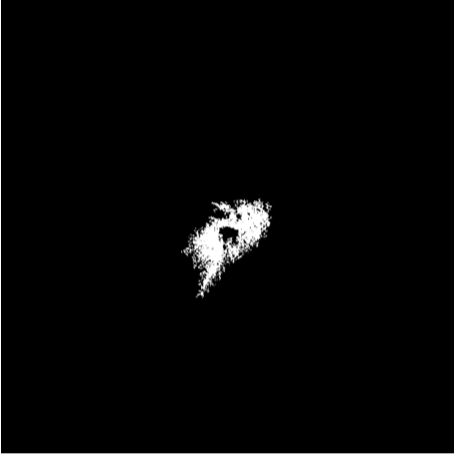
Find the difference between the 2 images:
In[]:=
difference=DeleteSmallComponents@ImageAdjust[ImageDifference[rawImageAfter,rawImageBefore],{10,3.8}]
Out[]=
Use morphological components to identify crater shape:
In[]:=
differenceShape=MorphologicalComponents[difference,Method->"ConvexHull"]//Colorize
Out[]=

The vast majority of impact craters in space are almost perfect circles. (The Geological Society of America.) The only exceptions to this pattern are low angle collisions, typically under 12 degrees. It is apparent that the crater is wider in one direction than the other, appearing more like an ellipse than a circle. This is characteristic of craters with low angles of impacts. For my attempt to recreate this crater, I had to utilize this information about the angle of impact.
Characterizing the Impact
Characterizing the Impact
Angle and speed of impact
Angle and speed of impact
In order to model the formation of craters, I had to characterize a few details about the impact. Firstly, I found the speed and angle of impact based on telemetry data.
Import and preprocess the telemetry data
In[]:=
rawData= ;tStart=Min[rawData[All,1]];data=rawData[All,{1(QuantityMagnitude[DateDifference[tStart, #],"Seconds"]&)}];times=Normal@data[[All,1]];altitudes=Normal@data[[All,2]];velocitiesY=Normal@data[[All,3]];velocitiesX=Normal@data[[All,4]];
I assumed a system of constant accelerations between data points. This assumption allowed me to linearly interpolate the velocity vectors and extrapolate the speed at impact.
Interpolate velocities X and Y with a linear interpolation function:
In[]:=
interVelocitiesY=Interpolation[Transpose[{times,velocitiesY}],InterpolationOrder->1];interVelocitiesX=Interpolation[Transpose[{times,velocitiesX}],InterpolationOrder->1];
Create a velocities function that is the vector sum of the X and Y components:
In[]:=
interVelocities[t_]=Sqrt[interVelocitiesY[t]^2+interVelocitiesX[t]^2];
For the extrapolation, I assumed that the last transmission of telemetry data happened 1 second before the lander hit the ground.
Extrapolate the data to calculate the approximate speed of impact:
In[]:=
Quantity[interVelocities[Last[times]+1],"Meters"/"Seconds"]//Quiet
Out[]=
For the angles, I used the velocity vectors to tell me the direction that the craft was facing.
Take the arctangent of the X and Y components of velocity to discover the angle of impact:
In[]:=
angles=Quantity[ArcTan[velocitiesX,velocitiesY],"Radians"];
In[]:=
angleOfImpact=UnitConvert[Last[angles],"Degrees"]
Out[]=
Note that this angle of impact is less than 12 degrees, corroborating our examination of the crater images.
Kinetic energy at impact
Kinetic energy at impact
The next step in modelling the formation of the crater was to calculate the kinetic energy at the time of impact.
The formula for kinetic energy is m where is mass and is velocity.
E
k
1
2
2
v
m
v
The Beresheet lunar lander weighed 150kg. Moreover, at the time of impact it had 76kg of fuel left. (Arch Mission)
Use formula for kinetic energy over the X and Y velocity lists:
In[]:=
kEnergies=0.5*(150+76)*(velocitiesX^2 + velocitiesY^2);
Out[]=
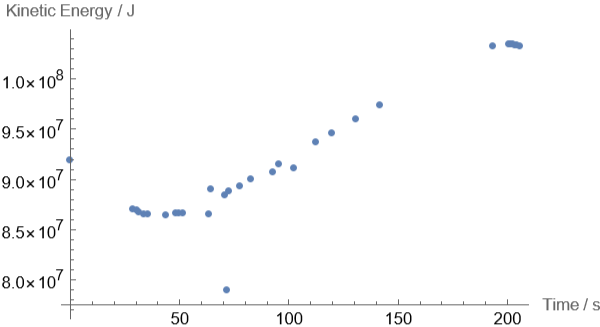
As seen in the graph, the kinetic energy of the lander increased over time. This is due to acceleration due to gravity and insufficient force from the thrusters.
Recreating the Impact Crater
Recreating the Impact Crater
Equation for lunar impact crater diameter
Equation for lunar impact crater diameter
As specified in the original paper (Horedt and Neukum), this formula utilized the CGS (Centimeter-Gram-Second) unit system.
Convert values into CGS (Centimeter-Gram-Second) unit system.
Plugging values into the crater diameter formula:
Now that I had a value for the crater’s diameter, I wanted to verify my results by comparing it with the actual crater.
Comparing predicted crater with actual crater
Comparing predicted crater with actual crater
To compare my prediction with the actual crater, I first had to identify the scale of the image. I used the positions of white pixels in the bottom right bar to calculate a meter:pixel image scale. After finding the exact scale of the image, I drew a disk to represent the predicted crater and overlayed on top of the actual crater.
Isolate the 100m bar in the image:
Use positions of white pixels to scale from meters to pixels:
Overlay the image of the predicted crater on the actual crater:
Considering the assumptions involved in this calculation, the predicted model of the crater was a very good estimate. The key missing feature was that the actual crater is elliptical and not circular. However, I did consider the angle of impact when creating my prediction.
Mapping Fuel Usage
Mapping Fuel Usage
Gravitational potential and total energy calculations
Gravitational potential and total energy calculations
First, I calculated the total energy in the lander at every point in the telemetry data.
Use formula for gravitational potential energy over the altitude list and calculate total energy:
Identify drops in total energy:
Calculate amount of useful work done :
Calculating fuel usage of lander
Calculating fuel usage of lander
The thrusters are converting chemical energy from their fuel to do useful work. Since I know the amount of useful work done, I can calculate the amount of fuel used.
The Beresheet lander used a Bi-Propellent engine with Hydrazine and Oxidizer in a 1:1 ratio. (Arch Mission) This allows us to calculate its chemical energy exactly. (PubChem) We’ll also assume that it’s about 60% efficient, since that is what is typical of most Bi-Propellent engines.
Chemical energy of fuel. The fuel is 1:1 ratio of hydrazine:oxidizer.
Assume 60 % efficiency of engine .
Calculate fuel drops:
Could the Lander have Saved Itself?
Could the Lander have Saved Itself?
Knowing that there were 76kg of fuel left in the thrusters and that only 2kg of fuel were used, the obvious question is was the lander saveable? Could it have decelerated in time?
Specifically, if the 76kg of fuel were expelled during the last 210 seconds, would the lander have been able to decelerate itself completely? Since this calculation includes a changing mass, I applied the rocket equation. (Tatum)
A typical bi-propellent thruster will have an exhaust velocity equaling 2940m/s:
We’ll assume it uses all 76kg of fuel:
To use the rocket equation, I had to create a model of how the mass changes with time. For the sake of simplicity, I assumed that the mass changes linearly from 226kg to 150kg across the total time. Then, I solved the equation for a function for velocity.
Predicted mass is a linear model:
Solve the rocket equation to model velocity over time:
From the graph, note that the velocity almost decelerates to 0. By integrating this predicted velocity, I found the distance covered during this time period.
Integrate the velocity function to get the distance as a function of time:
Multiply the distance by Sine of the original angle of descent to get the vertical component:
From the graph, note that the deceleration occurred at a very high altitude. The main problem with this model is that it assumes fuel is being used at a constant rate. With a more nuanced ejection of fuel, the lander could have decelerated and landed itself at the required location.
Thruster Forces and Trajectory Plots
Thruster Forces and Trajectory Plots
Many experts believe that the Beresheet lunar crash occurred due to some form of engine failure that led the thrusters to fire incorrectly. To explore this theory, I calculated the forces produced by the thruster throughout its journey. This allowed me to understand when the thrusters were fired and in what direction, either vertically or horizontally.
Calculating thruster forces
Calculating thruster forces
The acceleration at every point is found by taking the derivative of the velocity data. Moreover, as shown previously, the lander’s mass doesn’t vary much during its descent. It had a dry mass of 150kg and a fuel mass of 76kg (total of 226kg).
Get acceleration values:
Find the force produced by the thrusters by excluding lunar acceleration
When we graph these quantities, we begin to notice patterns.
For the Y-component of the thruster force, it is almost consistently negative. However, for the X-component, the thruster is firing erratically. Considering that the lander crashed into the ground at a very high horizontal speed, it should’ve been decelerating. Therefore, explaining this behaviour of the lunar lander is nontrivial.
One theory that I explored was to model this behaviour by applying spin to the lunar lander. In space, when an object starts spinning, it continues spinning without any forces of resistance. This spin would correspond to the seemingly random firing of the thruster. However, there was not a sufficient number of data points to verify this theory.
Creating trajectory and elevation plots
Creating trajectory and elevation plots
In order to further my understanding of the crash, I required to take the lander’s trajectory path and terrain into account. This provided me with an opportunity to analyze the data visually.
One can access elevation data of the moon locally in Wolfram. For the trajectory, I found the direction it was travelling by comparing the location of its last image and crash site. Moreover, I related its ground distances and altitudes to create a 3-dimensional trajectory plot.
To get the direction in which we’re travelling, we use the position that the lander was in at its last image and its crash.
By integrating the interpolated horizontal velocity, we get the ground distance at all the points in times.
Using GeoDestination, calculate (latitude, longitude) pairs in the path of the lunar lander:
Correlating the path with altitudes, calculate elevations in the path of the lunar lander:
Collating all the latitudes, longitudes, and altitudes, get the complete path:
Get the GeoElevation data of the moon in (latitude, longitude, altitude) form.
FInally, create the trajectory and elevation plot.
Note that the trajectory plot contains frequent changes in the lander’s direction of travel. This implies that the lander’s thrusters were firing at multiple points. Considering the data, the Beresheet lunar lander had some form of engine failure that prevented it from using its remaining fuel to land correctly.
In conclusion, these analyses of the Beresheet lunar crash provide deep insights into the challenges involved with lunar landings. By identifying areas for improvement and gaining a clearer understanding of the complexities involved, we can enhance the design and execution of future lunar missions.
Analyzing Landing Locations in Mare Serenitatis Crater
Analyzing Landing Locations in Mare Serenitatis Crater
In extending the project to have application for future lunar missions, I analyzed possible landing spots near the Beresheet mission’s intended location.
The Beresheet lunar lander planned to land at the “Mare Serenitatis” (Sea of Serenity) crater. The Mare Serenitatis crater is nearly 800km across and has been the site of many successful moon landings. I will be analyzing elevation data across the Mare Serenitatis crater to identify the flattest locations for landing.
Macro-view at Mare Serenitatis Crater
Macro-view at Mare Serenitatis Crater
In order to find suitable landing locations, I’ll plot the elevation data of the crater. Then, I’ll define a specific terrain smoothness function, that measures how flat the region around a point is. Finally, I am going to apply the terrain smoothness function across the crater to identify the best landing spots.
Get the elevation data:
Index the elevation data:
Plot the elevation data:
The terrain smoothness function will look at each point and measure the variation of elevation around that point. Specifically, it’ll search a 3x3 area around the point and calculate the difference between the Maximum and Minimum of elevations in that area.
Apply the terrain smoothness function across the whole crater:
Note that the regions colored in yellow are the smoothest regions. According to the terrainSmoothness model, these areas would be most suitable for lunar landings.
Identifying landing locations
Identifying landing locations
With the terrain smoothness function, I had a way to evaluate what regions are the flattest and best landing spots. I used this data to extract the smoothest points and consider large regions of those points to identify possible landing locations.
Get the data for terrain smoothness:
Filter the data for the smoothest regions:
Find the largest components of suitable regions :
Find the bounding boxes of the suitable regions :
It is important to note that these 4 landing locations are the best in terms of the “terrainSmoothness” metric. In a real lunar landing, there are probably multiple other factors to consider. However, I believe that measuring the flatness of the terrain is the primary factor for a landing location.
Micro-view of landing locations
Micro-view of landing locations
I conducted the same analysis of terrain smoothness at a micro-view on each of the 4 regions. This provided me with insights and details that were missed at larger scales.
Grab photos of the landing spots :
Get elevation data of the landing spots :
Index the elevation data of the landing spots :
Plot the elevation data while applying the smoothness function :
As expected from the pruning process, the selected landing locations had a very smooth terrain. However, zooming into the locations did bring out some imperfections that were not visible earlier.
Applications and Future Improvements
Applications and Future Improvements
The analysis of the Beresheet lunar crash and the insights gained from it have significant applications in the field of space exploration. Understanding the factors that led to the crash enables us to make informed decisions and improvements for future lunar missions. Moreover, by identifying the key challenges involved with such missions, we can focus our technological development and enhance the design of future lunar landers.
The analysis of possible landing locations presented in this project serves as a foundation for further assessment and evaluation based on additional factors. Overall, the process of finding and identifying landing locations gave me the opportunity to contribute to the collective knowledge of lunar landing missions for the future.
By acquiring and analyzing additional data from other lunar missions, I would be able to conduct a comparative analysis. By collecting more data from the successes and failures of other missions, I could gain a more comprehensive understanding of the factors contributing to the Beresheet lunar crash.
Acknowledgements
Acknowledgements
◼
Daniele Ceravolo
◼
Isabel Skidmore
◼
Thanasis Paraskevopoulos
◼
Macy Levin
References
References
1
.Wolfram, Stephen. “Analyzing the Beresheet Impact.” Wolfram Cloud, 2019, www.wolframcloud.com/objects/s.wolfram/Published/BeresheetAnalysis.nb. Accessed 13 July 2023.
2
.Arch Mission. “Find The Lunar Library - Treasure Hunt on the Moon.” Google Docs, docs.google.com/document/d/1gaJCdbyBGLQdbs1NGxsVrs1b1lAinqQXNnA5URSoIA8/edit. Accessed 13 July 2023.
3
.The Geological Society of America. “Low-angle Collision With Earth: The Elliptical Impact Crater Matt Wilson, Northern Territory, Australia.” ScienceDaily, 8 May 2009, www.sciencedaily.com/releases/2009/05/090505072948.htm. Accessed 13 July 2023.
4
.Horedt, G. P., and G. Neukum. “Comparison of six crater-scaling laws.” Earth, Moon and Planets, vol. 31, no. 3, 1984, pp. 265-269.
5
.PubChem. “Hydrazine.” PubChem, pubchem.ncbi.nlm.nih.gov/compound/hydrazine#section=Heat-of-Combustion. Accessed 13 July 2023.
6
.Tatum, Jeremy. “10.3: The Rocket Equation.” Physics LibreTexts, 8 Aug. 2022, phys.libretexts.org/Bookshelves/Classical_Mechanics/Classical_Mechanics_(Tatum)/10%3A_Rocket_Motion/10.03%3A_The_Rocket_Equation. Accessed 13 July 2023.
7
.Warner, Cheryl. “Update on First Private Robotic Spacecraft Attempt at Moon Landing.” NASA, 10 Apr. 2019, www.nasa.gov/feature/update-on-first-private-robotic-spacecraft-attempt-at-moon-landing. Accessed 13 July 2023.
CITE THIS NOTEBOOK
CITE THIS NOTEBOOK
Recreate the Beresheet lunar crash
by Dev Sharma
Wolfram Community, STAFF PICKS, July 13, 2023
https://community.wolfram.com/groups/-/m/t/2964599
by Dev Sharma
Wolfram Community, STAFF PICKS, July 13, 2023
https://community.wolfram.com/groups/-/m/t/2964599