Plotting two functions on the same axis but with different
x value domains
Plotting two functions on the same axis but with different
x value domains
x value domains
Suppose you want to plot two functions on the same graph but each function should be shown over a different x value domain. The following is
one way of accomplishing this.
one way of accomplishing this.
Show[Plot[Cos[x],{x,0,π},PlotRange{{-10,10},{-1.5,1.5}},PlotStyleRed],Plot[Sin[x],{x,-2*π,2*π},PlotRange{{-10,10},{-1.5,1.5}}]]
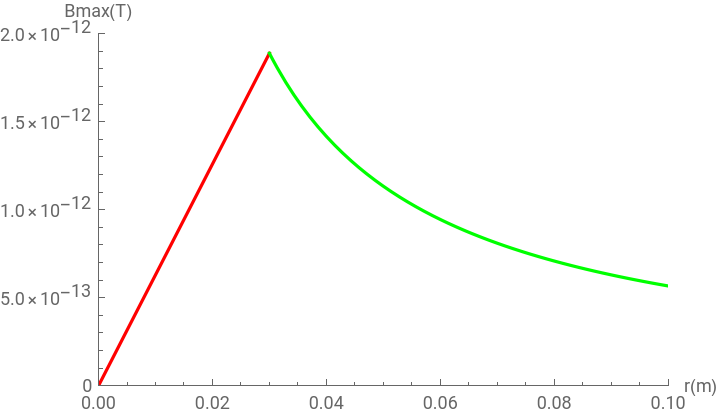
Another example
In[]:=
Brsmall=6.293571538156059`*^-11rsmall;Brbig=;
5.664214384340453`*^-14
rbig
In[]:=
Show[Plot[Brsmall,{rsmall,0,R11},PlotRange{{0,0.1},{0,2*10^-12}},PlotStyleRed,PlotLegends{"Brsmall"},AxesLabel{"r(m)","Bmax(T)"}],Plot[Brbig,{rbig,R11,0.1},PlotRange{{0,0.1},{0,2*10^-12}},PlotStyleGreen,PlotLegends{"Brbig"}]]
Out[]=