The Wolfram Emerging Leaders Program: High School (WELP:HS) is a remote, semester-long program designed for exceptional graduates from the Wolfram High School Summer Research Program to continue to develop their skills. Students work in a small group over the course of a semester to do either a research-based project or a product development–based project under the guidance of expert mentors. Projects are centered around a topic at the intersection of the group’s interests.
This project simulates how often different voting systems produce paradoxical outcomes when converting individual votes into a cumulative decision. Using the Wolfram Language, we modeled simple plurality, Borda count, two-round runoff, and instant run-off voting systems, and we validated our functions on a fixed voting pool. Next, we tested each system for paradoxes such as Independence of Irrelevant Alternatives (IIA), Arrow’s Impossibility Theorem, and the Spoiler Effect. To better represent realistic electorates, we generated synthetic populations from voter-candidate ideological profiles over multiple binary issues; voter rankings were produced through Euclidean distance analysis, and population polarization was created by skewing selected issue distributions. Results show that paradox frequency depends heavily on the population profile: systems with first-choice votes are more sensitive to the spoiler effect and candidate-field changes in some electorates, while rank-based methods can still exhibit IIA and outcome reversals. Our framework enables controlled, quantitative comparison of the efficacy of voting rules under realistic population preferences.
Introduction
Introduction
From simple households to national elections, voting systems play a crucial role in determining who represents us and, consequently, in shaping the way our communities, cities, and nations are governed. However, as social choice theory reveals, aggregating individual preferences into a collective decision is inherently complex. This difficulty often leads to voting paradoxes that result in inconsistent or counter-intuitive outcomes. This project aims to simulate the occurrence of voting paradoxes under varying population profiles and compare how effectively different voting systems mitigate or exacerbate these paradoxes.
Voting Systems
Voting Systems
There are several voting systems utilized around the world. We will first focus on majority/plurality voting systems by modeling these systems using the Wolfram Language. These systems require the winning candidate to garner either a plurality or majority of the votes. The inputs from voters we will utilize (for later purposes of analysis, though may not be representative of reality) are a list of each voter’s ranked preferences for each candidate. For example, if a voter’s input is {2,3,1,4}, this voter ranked the second candidate first, third candidate second, first candidate third, and fourth candidate last.
For each voting system, we will display the result for the following randomized population of voters’ inputs.
The following code generates a list of voter inputs with six candidates and 50 voters.
In[]:=
numCandidates=6;numVoters=50;
In[]:=
Inactive[votes=ToUpperCase@Table[RandomSample[Alphabet[][[1;;6]]],numVoters]];
For ease of initial demonstration, the votes will be fixed as follows
In[]:=
votes={{"A","D","B","C","E","F"},{"A","F","C","D","E","B"},{"E","F","B","C","D","A"},{"D","E","A","F","C","B"},{"E","A","D","F","B","C"},{"D","B","C","E","A","F"},{"C","E","D","F","A","B"},{"A","B","E","F","C","D"},{"C","B","A","F","E","D"},{"C","D","A","F","E","B"},{"C","F","A","E","B","D"},{"F","D","B","C","E","A"},{"E","B","D","A","C","F"},{"D","B","F","C","A","E"},{"D","B","E","C","A","F"},{"D","A","F","E","C","B"},{"A","E","D","C","F","B"},{"B","F","D","A","E","C"},{"F","E","C","D","B","A"},{"E","C","D","B","A","F"},{"E","A","D","B","F","C"},{"F","E","B","A","C","D"},{"D","B","C","F","E","A"},{"D","C","A","F","B","E"},{"D","F","E","A","B","C"},{"D","B","C","E","A","F"},{"E","B","A","D","C","F"},{"F","A","C","B","E","D"},{"C","B","D","F","A","E"},{"B","C","F","D","E","A"},{"C","F","E","A","D","B"},{"B","C","F","D","A","E"},{"C","A","D","F","B","E"},{"A","D","E","F","C","B"},{"F","C","B","D","A","E"},{"A","C","F","B","D","E"},{"C","A","B","F","D","E"},{"E","F","C","D","B","A"},{"D","F","B","A","C","E"},{"C","F","D","B","A","E"},{"C","E","A","D","B","F"},{"D","E","C","B","F","A"},{"A","E","D","C","B","F"},{"D","C","F","B","E","A"},{"B","D","F","E","A","C"},{"B","F","E","C","A","D"},{"A","B","D","E","C","F"},{"C","A","E","D","B","F"},{"B","F","D","E","C","A"},{"F","E","B","D","C","A"}};
Simple Plurality Voting
Simple Plurality Voting
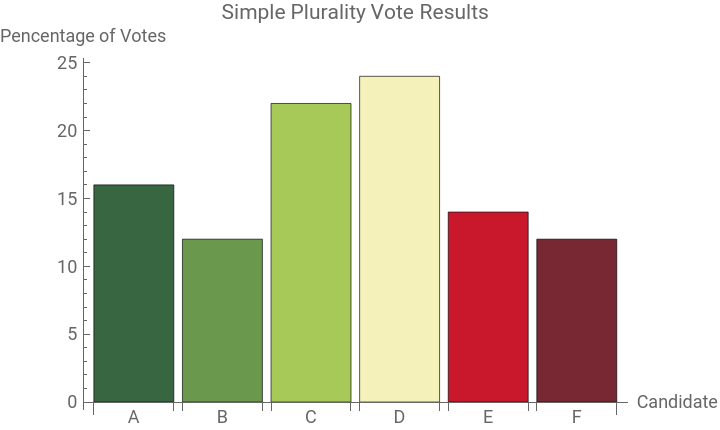
In simple plurality or relative-majority voting systems, a candidate wins by receiving the largest number of votes in the election. This need not exceed 50%, unlike in simple majority voting systems. For example, consider an election in which candidate A receives 45% of the votes, candidate B 40%, candidate C 10%, and candidate D 5%. Candidate A would be declared the winner, even though a majority of voters did not vote for A. Furthermore, this voting system is vulnerable to the spoiler effect if voters for candidates C and D have candidate B as their second preference. In that case, candidate B’s chances of winning is lower, since the presence of candidates C and D divides support that would otherwise go to B.
Tallies the first choice of each voter’s input and determines the winner according to who has the most votes
In[]:=
simplePlurality[votes_]:=Module[{tally,result},tally=Sort[Tally@votes[[All,1]]];<|"Candidates"->tally[[All,1]],"Results"->Interpreter["PercentFraction"]/@(#[[2]]&/@tally/Total[tally[[All,2]]])(*tally/.{_,y_}:>Interpreter["PercentFraction"][N[y/Length[votes]]]*),"Winner"->First@Last@SortBy[tally,Last]|>]
Testing
Testing
Result of the initial voting population in a simple plurality voting system
In[]:=
ballots=simplePlurality[votes]
Out[]=
Candidates{A,B,C,D,E,F},Results,,,,,,WinnerD
Bar chart highlighting the winner of the simple plurality voting system
In[]:=
BarChart[ballots["Results"],ChartLabels->ballots["Candidates"],ChartStyle->{RGBColor["#386641"],RGBColor["#6a994e"],RGBColor["#a7c957"],RGBColor["#f4f1bb"],RGBColor["#c9182c"],RGBColor["#782832"]},AxesLabel->{"Candidate","Pencentage of Votes"},PlotLabel->"Simple Plurality Vote Results"]
Out[]=
Borda Count Voting
Borda Count Voting
The Borda method assigns each candidate a number of points based on their position in each ballot. For example, if a voter ranks candidate A first, candidate B second, and candidate C third, then candidate A receives 3 points, candidate B 2 points, and candidate C 1 point. After points are assigned for all ballots, they are summed for each candidate, and the candidate with the highest total score wins the election. Unlike the simple plurality voting system, this rank-based method takes all voters’ preferences into account. The Borda method violates the Independence of Irrelevant Alternatives because voters can strategically rank strong candidates very low, which can change which candidate wins, even if that strong candidate has no real chance of winning.
Assigns points according to the rank of a candidate for each voter, tallies those points, and determines the winner according to who has the most votes
In[]:=
bordaCount[votes_]:=Module[{rankedVotes,result},rankedVotes=Map[Association@MapThread[(#1->#2)&,{Sort[#],numCandidates-Ordering[#]}]&,votes];result=Merge[rankedVotes,Total];<|"Candidates"->Keys@result,"Results"->Map[Interpreter["PercentFraction"][#]&,N[Values[result]/(Total[result])]],"Winner"->First@Keys@TakeLargest[result,1]|>]
Testing
Testing
Result of the initial voting population in a Borda count voting system
In[]:=
ballots=bordaCount[votes]
Out[]=
Candidates{A,B,C,D,E,F},Results,,,,,,WinnerD
Bar chart highlighting the winner of the Borda count voting system
In[]:=
BarChart[ballots["Results"],ChartLabels->ballots["Candidates"],ChartStyle->{RGBColor["#386641"],RGBColor["#6a994e"],RGBColor["#a7c957"],RGBColor["#f4f1bb"],RGBColor["#c9182c"],RGBColor["#782832"]},AxesLabel->{"Candidate","Percentage of Points"},PlotLabel->"Borda Vote Results"]
Out[]=
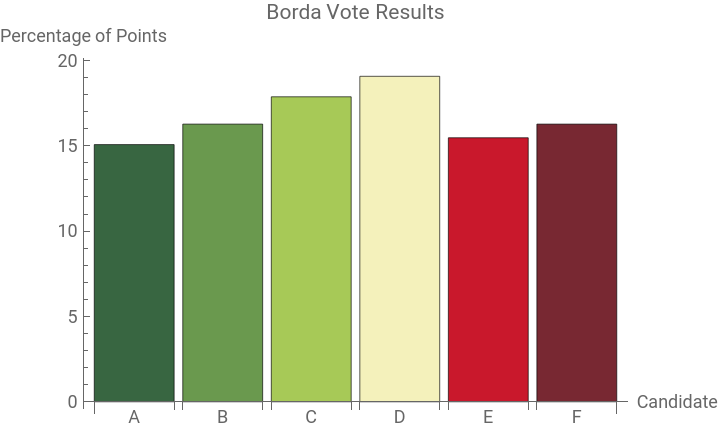
As we can see from this graph, even though the number of points that each of the candidates are around the same, the winner from this system is also the fourth candidate, with 193 points from the overall voting system.
Two Round Runoff Voting
Two Round Runoff Voting
The two-round runoff system selects a winner through up to two stages of voting. In the first round, every voter chooses one candidate on their ballot. All the votes are counted, and the top two candidates move on to the second round. In the runoff, voters choose again between the two candidates. In our case, we utilize the voters’ initial ranking of the two candidates in the runoff. The candidate that gains the majority of votes wins the election. For example if candidate 2 gets 7 votes and candidate 3 gets 6 votes, while the other 4 candidates - candidate 1, candidate 4, candidate 5, and candidate 6 - each get fewer votes than that, candidate 2 and 3 move on to the runoff. In the second round based on the voter’s preference for second choice is counted. Finally, based on the first and second run, the candidate with the majority of votes in this round win the election.
Tallies first round point, determine top two candidate, tallies second round points, and determines the winner
In[]:=
twoRoundRunoff[votes_]:=Module[{ballotsFirstRound,ballotsSecondRound,topTwo,secondRoundResult},ballotsFirstRound=simplePlurality[votes];(*picktoptwocandidates*)topTwo=ballotsFirstRound["Candidates"][[Ordering[ballotsFirstRound["Results"],-2]]];ballotsFirstRound=ResourceFunction["KeyReplace"][ballotsFirstRound,"Results"->"Round 1 Results"];ballotsFirstRound=KeyDrop[ballotsFirstRound,"Winner"];(*pickingwhoeverrankedhigher*)ballotsSecondRound=simplePlurality[Select[#,MemberQ[topTwo,#]&]&/@votes];<|ballotsFirstRound,"Round 2 Candidates"->topTwo,"Round 2 Results"->ballotsSecondRound["Results"],"Winner"->ballotsSecondRound["Winner"]|>]
Testing
Testing
Result of the initial voting population in a two-round runoff voting system
Bar charts highlighting the winner of the two-round runoff voting system
From this graph, we can see that candidate 4 would be the winner as they achieved the most number of votes when a two-round runoff was conducted.
Instant Runoff Voting
Instant Runoff Voting
An instant runoff voting system determines a winner by repeatedly removing the lowest-ranked candidate. The process of elimination continues until a candidate receives more than 50% of the votes. For example, if in the first round candidate 6 was the lowest-ranked candidate and the leading candidate does not surpass 50% of the votes, candidate 6 is eliminated, and another round of run off begins. In the second round, if candidate 3 was the lowest-ranked candidate and the leading candidate still does not surpass 50% of the votes, candidate 3 is eliminated, and another round of run off begins. In the third round, if the candidate 4 is the lowest-ranked candidate and the leading candidate still has not surpassed 50% of the votes, candidate 4 is eliminated. Finally, in the fourth round, if candidate 1 is the leading candidate, and has now surpassed 50% of the votes, candidate 1 is named the winner.
Tallies first round point, removes bottom candidate, tallies second round points, removes bottom candidate, and repeats until a winner is determined.
Testing
Testing
Result of the initial voting population in an instant runoff voting system
Bar chart highlighting the winner of the instant runoff voting system
From this graph we can see that the winner is the fourth candidate, as they achieved more than 50% of the votes in the 5th round.
Paradoxes
Paradoxes
As stated in social choice theory, individual preferences don’t necessarily translate well into a consistent group preference even if each voter’s ranking is logical in its own ways. There are sometimes cycles that occur or loss of information when aggregating votes. Below we present 3 voting paradoxes that can occur in different voting systems: Independence of Irrelevance Alternatives in Simple Plurality Voting System, Arrow’s Impossibility Theorem, and Spoiler Effect.
Independence of Irrelevance Alternatives
Independence of Irrelevance Alternatives
Independence of irrelevance alternatives requires that a group’s choice between two candidates depends only on how voters rank those two candidates. To illustrate, if voters prefer candidate A over candidate B, and candidate C enters or leaves the election, the relative standing of A and B should remain the same. Candidate C is “irrelevant” to the winning between candidates A and B. If candidate C does change the outcome, then the votes in the specific voting method violates the paradox.
Establishes the candidate set and tests removal of each non-winning candidate to detect IIA paradox.
Testing
Testing
Detecting violation of independence of irrelevance alternatives in votes with simple plurality voting system
Detecting violation of independence of irrelevance alternatives in votes with Borda count voting system
Detecting violation of independence of irrelevance alternatives in votes with two-round runoff voting system
Detecting violation of independence of irrelevance alternatives in votes with instant runoff voting system
From above, the independence of irrelevance alternatives was not detected in any of the voting systems given the same population. This finding means that, within this population, the winning candidate would not change if there were a change in the candidate pool.
Arrow’s Impossibility Theorem
Arrow’s Impossibility Theorem
Arrow’s Impossibility Theorem states that no voting system can convert individual ranked preferences into a single group ranking while satisfying all of a few core fairness conditions at the same time. These conditions include respecting unanimous agreement, avoiding a single voter dictating the outcome, and keeping the group’s choice between two candidates independent of any others. Arrow showed that any method that tries to meet all of these requirements will inevitably violate at least one of them.
Checks for IIA paradox and applies additional unanimity checks and non-dictatorship checks to detect the Arrow’s Impossibility paradox.
Testing
Testing
Detecting violation of arrow’s impossibility theorem criteria in votes with simple plurality voting system
Detecting violation of arrow’s impossibility theorem criteria in votes with Borda count voting system
Detecting violation of arrow’s impossibility theorem criteria in votes with two-round runoff voting system
Detecting violation of arrow’s impossibility theorem criteria in votes with instant runoff voting system
The results above reaffirms Arrow’s Impossibility Theorem in which, for every voting system, dictatorship and non-unanimity was detected.
Spoiler Effect
Spoiler Effect
The Spoiler Effect is when the presence of a non-winning candidate on the ballot affects the outcome of the election. For instance, suppose an election consists of three candidates---A, B, and C. Candidate A may win when all three candidates are present in the ballot; however, if candidate C were to be removed, the spoiler effect happens when candidate B wins instead of candidate A. This phenomenon usually happens when candidates have similar ideologies, policies, etc.
Tallies the voters’ preferences with no candidates removed, and one non-winning candidate removed, then compares the winner of each round
Testing
Testing
Detecting spoiler effect in simple plurality voting system
Detecting spoiler effect in Borda count voting system
Detecting spoiler effect in two-round runoff voting system
Detecting spoiler effect in instant runoff voting system
The false detection of the spoiler effect in all of the voting systems demonstrate that no third candidate would change the results of the top contenders; in this case, the top two contenders are candidates C and D.
Creating Synthetic Populations
Creating Synthetic Populations
To generate synthetic populations, we want to simulate how individuals, including voters and candidates, favor policies/opinions in different issues. Thus, instead of generating a random ranking for each individual, we can calculate how closely each individual aligns with different candidates based on each of their ideas on different issues.
Generates a list of each voters’ opinions on different issues. For example, the first index could represent abortion. 1 means that the individual agrees, while 0 means the individual disagrees.
Utilizes the distance between the voter and candidates to rank the candidates
We can now generate a list similar to the original list given above.
This method also allows us to create skewed populations where individuals are more likely to agree on a specific issue.
Testing Each Voting System’s Susceptibility to Each Paradox
Testing Each Voting System’s Susceptibility to Each Paradox
Combining the different sections, we will now run different synthetic populations under different voting systems and test for the existence of paradoxes in each. We created several helper functions. Overall, the function generates a synthetic population, tallies up the vote for the given voting system, checks for the existence of voting paradoxes, repeats for a number of randomly generated populations, and calculates the percent occurrence of each paradox
Convert the results to associations.
Generate a ranked population
Check the occurrence of paradoxes in the generated population
Vote and count iteration, returning increments
Calculate the votes and determine frequency of paradoxes over each completed vote, then return an average
Population #1
Population #1
We first test a population with 100 voters and 6 candidates to different voting systems. We do this with 100 trials for this example, but waiting for the calculation to run for 2000+ trails will yield more accurate results.
Test for paradoxes from population #1 in simple plurality system
Test for paradoxes from population #1 in Borda count voting system
Test for paradoxes from population #1 in two-round runoff voting system
Test for paradoxes from population #1 in instant runoff voting system
Analysis for Population #1
Analysis for Population #1
The first observation is that the probabilities of unanimity holding is relative low and dictatorship being detected is relatively high across all voting systems; this reaffirms that both conditions are relatively hard to hold in any system according to Arrow’s Impossibility Theorem. The occurrence of the IIA and Spoiler Effect are the same for each voting system, which reflects how the spoiler effect is a manifestation of the IIA Paradox. However, the rate of both paradoxes occurring vary between the different voting systems: Borda count having the highest occurrence rate, followed by simple plurality; the two runoff systems have similar probabilities, coming in last.
Population #2
Population #2
We now test a population with 1000 voters and 4 candidates to different voting systems, a population of larger size and less candidates. We do this with 50 trials for this example, but waiting for the calculation to run for 2000+ trails will yield more accurate results.
Test for paradoxes from population #2 in simple plurality voting system
Test for paradoxes from population #2 in Borda count voting system
Test for paradoxes from population #2 in two-round runoff voting system
Test for paradoxes from population #2 in instant runoff voting system
Analysis for Population #2
Analysis for Population #2
Similar observations can be made of population #2 from population #1. The occurrence of unanimity holding is still relatively low, and the probability of dictatorship being detected is still high. However, the magnitude of probability of dictatorship being detected is much higher with this population, likely due to the larger size of the population. This could suggest the trend that individual preferences are harder to aggregate when there are more of them.
The occurrence of the IIA and Spoiler Effect are also the same, but the difference between the voting systems are more clearly exhibited. Borda count and simple plurality both have probabilities of around 40%, while the runoff systems lie around 25-30%.
Comparison chart
Comparison chart
To more clearly demonstrate the differences in the occurrence of different paradoxes, we can plot the probabilities of each in a bar chart.
Generates the probabilities of the occurrence of paradoxes in different voting systems with a population of 20 voters and 6 candidates
Plots the probabilities of the population above
Generates the probabilities of the occurrence of paradoxes in different voting systems with a population of 100 voters and 4 candidates
Plots the probabilities of the population above
Conclusion
Conclusion
Our voting simulations reveal that while no voting system fully escapes Arrow-style paradoxes, the frequency and severity of these paradoxes varies depending on the voting system and the structure of the electorate. Larger electorate populations could lead to higher occurrence of such paradoxes, further emphasizing the ideas of social choice theory. As for voting systems, runoff systems tend to exhibit lower rates of the IIA and Spoiler Effect, suggesting that such systems help prevent distortions of the results when a candidate is removed from an election. From these simulations, though no system is theoretically perfect in representing individual preferences, runoff systems could better represent voters’ voices, implanting a stronger democracy within the larger system.
To obtain more conclusive results, future studies should focus on developing a broader set of voting systems and paradoxes, evaluating these paradoxes across varying population sizes and preference distributions (right or left-winged), and testing counter-measures to combat the occurrence of voting paradoxes.
To obtain more conclusive results, future studies should focus on developing a broader set of voting systems and paradoxes, evaluating these paradoxes across varying population sizes and preference distributions (right or left-winged), and testing counter-measures to combat the occurrence of voting paradoxes.
Acknowledgements
Acknowledgements
We would like to acknowledge our mentor, Angel Rojas, for his help throughout the project, especially during the ideation part of the project. We would also like to thank Rory Foulger for his endless support throughout the whole program, whether it be during the project check-ins or during the final weeks of debugging. During all the check-ins, Rory was very encouraging, helping us through some errors, providing feedback on possible ways to improve the delivery of the information, and much more. Along with Rory, we would like to thank Eryn Gillam for their help during our mid-project check-in, ensuring that everything was running and proceeding smoothly.
References
References
◼
Felsenthal, Dan S. “Review of paradoxes afflicting various voting procedures where one out of m candidates (m≥ 2) must be elected.” (2010): 1-52.
◼
How Do Single-Winner and Multi-Winner Ranked-Choice Voting Work? | Portland.Gov. https://www.portland.gov/vote/ranked-choice-voting/tabulation.
◼
Kovalchuk, Gregory. “Building an Instant Runoff Voting Algorithm in Python.” Medium, 21 Nov. 2024, https://medium.com/@goldengrisha/building-an-instant-runoff-voting-algorithm-in-python-b9a9ad2ca97d.
◼
Wolk, Sara. “STAR Voting: Heal Democracy!” County Democrat Reader, 24 May 2020, https://medium.com/countydemocratreader/star-voting-heal-democracy-71570e2f41ae.
CITE THIS NOTEBOOK
CITE THIS NOTEBOOK
Modeling the susceptibility of different voting systems to the occurrence of paradoxes
by Aanya Gupta, Cookie Danchaivijitr, and Diya Venkataragavan
Wolfram Community, STAFF PICKS, February 17, 2026
https://community.wolfram.com/groups/-/m/t/3641212
by Aanya Gupta, Cookie Danchaivijitr, and Diya Venkataragavan
Wolfram Community, STAFF PICKS, February 17, 2026
https://community.wolfram.com/groups/-/m/t/3641212