We compute the stripping and rectifying composition profiles of an ideal ternary mixture at atmospheric pressure. The mixture consists of three components:
Pentane = component 1
Hexane = component 2
Heptane = component 3
Pentane = component 1
Hexane = component 2
Heptane = component 3
The constant relative volatilities are taken equal to 6.35 and 2.47. For ternary systems with constant relative volatilities, we have the following relation between liquid and vapor mole fractions :=, where (i.e., component 3 is the reference component).
y
i
α
ik
x
i
3
∑
j=1
α
jk
x
j
k=3
The reflux and reboil ratios are set equal to 2.5 and 1.35, respectively. Feed is saturated liquid with the following composition : 30% Pentane, 30% Hexane, 40% Heptane. Additional specifications are as follows:
Distillate composition: 95% Pentane, 4.9% Hexane, 0.1% Heptane.
Bottom composition: 0.1% Pentane (illustration 1) or 0.0001% Pentane (illustration 2).
Distillate composition: 95% Pentane, 4.9% Hexane, 0.1% Heptane.
Bottom composition: 0.1% Pentane (illustration 1) or 0.0001% Pentane (illustration 2).
We successfully reproduce Fig. 4.3a and 4.3b of Ref. 1.
ILLUSTRATION 1
Overall Material Balance gives Bottom composition:
0.1% Pentane, 41.54% Hexane, 58.4% Heptane
Without loss of generality, we take F = feed flow rate = 1 kmol/hr as a basis.
Overall Material Balance gives Bottom composition:
0.1% Pentane, 41.54% Hexane, 58.4% Heptane
Without loss of generality, we take F = feed flow rate = 1 kmol/hr as a basis.
In[]:=
Clear["x*","y*"];
In[]:=
F=1;
In[]:=
FindRoot[{FDist+B,F0.3Dist0.95+B0.001,F0.3Dist0.049+BHBottom},{B,1},{Dist,0.8},{HBottom,0.7}]
Out[]=
{B0.684932,Dist0.315068,HBottom0.41546}
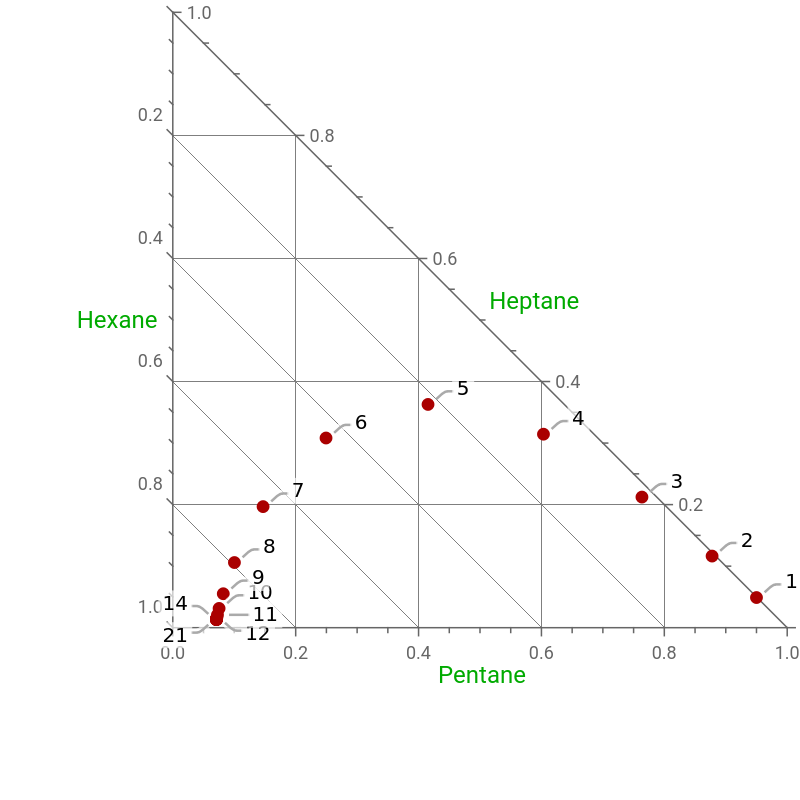
Calculation of the liquid composition profile in the Rectifying Section with 10 Stages. Reflux ratio is equal to 2.5.
In[]:=
r=2.5;(*refluxratio*)
In[]:=
d[1]=0.95;d[2]=0.049;d[3]=0.001;(*distillatecomposition*)Ne=20;(*numberofstages*)
In[]:=
xr[1,Ne]=0.95;xr[2,Ne]=0.049;xr[3,Ne]=0.001;
In[]:=
Rect[i_,n_]:=yr[i,n-1]r/(r+1)xr[i,n]+d[i]/(r+1)(*rectifyingsectionoperatingline*)
In[]:=
a[1]=6.35;a[2]=2.47;a[3]=1;(*relativevolatilities*)
In[]:=
sol=NSolve[{xr[1,Ne]a[1]xr[1,Ne-1]/Sum[a[j]xr[j,Ne-1],{j,1,3}],xr[2,Ne]a[2]xr[2,Ne-1]/Sum[a[j]xr[j,Ne-1],{j,1,3}],1Sum[xr[j,Ne-1],{j,1,3}]},{xr[1,Ne-1],xr[2,Ne-1],xr[3,Ne-1]}]
Out[]=
{{xr[1,19]0.877743,xr[2,19]0.11639,xr[3,19]0.00586702}}
In[]:=
xr[1,Ne-1]=sol[[1,1,2]]
Out[]=
0.877743
In[]:=
xr[2,Ne-1]=sol[[1,2,2]]
Out[]=
0.11639
In[]:=
xr[3,Ne-1]=sol[[1,3,2]]
Out[]=
0.00586702
In[]:=
Eq1[i_,n_]:=xr[i,n]yr[i,n]/a[i]1/Sum[yr[j,n]/a[j],{j,1,3}](*equilibriumrelations*)
In[]:=
Sys1=Table[Rect[i,n],{i,1,3},{n,1,Ne-1}];
In[]:=
Sys2=Table[Eq1[i,n],{i,1,3},{n,0,Ne-2}];
In[]:=
System1=Flatten[Join[Sys1,Sys2]];
In[]:=
unk1=Table[{xr[i,n],0.2},{i,1,3},{n,0,Ne-2}];
In[]:=
unk2=Table[{yr[i,n],0.5},{i,1,3},{n,0,Ne-2}];
In[]:=
Unknown1=Flatten[Join[unk1,unk2],1];
In[]:=
sol1=FindRoot[System1,Unknown1]
Out[]=
{xr[1,0]0.0709915,xr[1,1]0.0709918,xr[1,2]0.0709927,xr[1,3]0.0709947,xr[1,4]0.0709996,xr[1,5]0.0710114,xr[1,6]0.07104,xr[1,7]0.0711093,xr[1,8]0.0712779,xr[1,9]0.0716914,xr[1,10]0.0727197,xr[1,11]0.0753328,xr[1,12]0.0821565,xr[1,13]0.100303,xr[1,14]0.146924,xr[1,15]0.249391,xr[1,16]0.415408,xr[1,17]0.603285,xr[1,18]0.763588,xr[2,0]0.0133247,xr[2,1]0.0133264,xr[2,2]0.0133303,xr[2,3]0.0133398,xr[2,4]0.0133628,xr[2,5]0.013418,xr[2,6]0.0135511,xr[2,7]0.0138716,xr[2,8]0.0146426,xr[2,9]0.0164935,xr[2,10]0.0209134,xr[2,11]0.031336,xr[2,12]0.0551776,xr[2,13]0.105876,xr[2,14]0.196749,xr[2,15]0.308242,xr[2,16]0.362805,xr[2,17]0.314442,xr[2,18]0.212252,xr[3,0]0.915684,xr[3,1]0.915682,xr[3,2]0.915677,xr[3,3]0.915665,xr[3,4]0.915638,xr[3,5]0.915571,xr[3,6]0.915409,xr[3,7]0.915019,xr[3,8]0.91408,xr[3,9]0.911815,xr[3,10]0.906367,xr[3,11]0.893331,xr[3,12]0.862666,xr[3,13]0.793822,xr[3,14]0.656327,xr[3,15]0.442367,xr[3,16]0.221787,xr[3,17]0.0822734,xr[3,18]0.0241603,yr[1,0]0.322137,yr[1,1]0.322138,yr[1,2]0.322139,yr[1,3]0.322143,yr[1,4]0.322151,yr[1,5]0.322171,yr[1,6]0.322221,yr[1,7]0.322341,yr[1,8]0.322637,yr[1,9]0.323371,yr[1,10]0.325238,yr[1,11]0.330112,yr[1,12]0.343073,yr[1,13]0.376374,yr[1,14]0.449565,yr[1,15]0.568149,yr[1,16]0.702346,yr[1,17]0.816848,yr[1,18]0.898388,yr[2,0]0.0235188,yr[2,1]0.0235216,yr[2,2]0.0235284,yr[2,3]0.0235448,yr[2,4]0.0235843,yr[2,5]0.0236794,yr[2,6]0.0239083,yr[2,7]0.024459,yr[2,8]0.0257811,yr[2,9]0.0289381,yr[2,10]0.0363828,yr[2,11]0.0534126,yr[2,12]0.0896254,yr[2,13]0.154535,yr[2,14]0.234173,yr[2,15]0.273146,yr[2,16]0.238601,yr[2,17]0.165609,yr[2,18]0.0971359,yr[3,0]0.654344,yr[3,1]0.654341,yr[3,2]0.654332,yr[3,3]0.654313,yr[3,4]0.654265,yr[3,5]0.654149,yr[3,6]0.653871,yr[3,7]0.6532,yr[3,8]0.651582,yr[3,9]0.647691,yr[3,10]0.638379,yr[3,11]0.616476,yr[3,12]0.567301,yr[3,13]0.469091,yr[3,14]0.316262,yr[3,15]0.158705,yr[3,16]0.0590525,yr[3,17]0.0175431,yr[3,18]0.00447644}
In[]:=
Do[xr[1,i]=(xr[1,i]/.sol1),{i,0,Ne}]
In[]:=
Do[xr[2,i]=(xr[2,i]/.sol1),{i,0,Ne}]
In[]:=
tbl1=Table[{xr[1,i],xr[2,i],1-xr[1,i]-xr[2,i]},{i,0,Ne}]
Out[]=
{{0.0709915,0.0133247,0.915684},{0.0709918,0.0133264,0.915682},{0.0709927,0.0133303,0.915677},{0.0709947,0.0133398,0.915665},{0.0709996,0.0133628,0.915638},{0.0710114,0.013418,0.915571},{0.07104,0.0135511,0.915409},{0.0711093,0.0138716,0.915019},{0.0712779,0.0146426,0.91408},{0.0716914,0.0164935,0.911815},{0.0727197,0.0209134,0.906367},{0.0753328,0.031336,0.893331},{0.0821565,0.0551776,0.862666},{0.100303,0.105876,0.793822},{0.146924,0.196749,0.656327},{0.249391,0.308242,0.442367},{0.415408,0.362805,0.221787},{0.603285,0.314442,0.0822734},{0.763588,0.212252,0.0241603},{0.877743,0.11639,0.00586702},{0.95,0.049,0.001}}
In[]:=
Length[tbl1]
Out[]=
21
Rectifying profile
The points’ labels indicate the stage number (we count starting from the top).
The points’ labels indicate the stage number (we count starting from the top).
In[]:=
plt1=TernaryListPlot[Reverse@tbl1->Range[21],PlotRange{{0,1},{0,1}},AspectRatio1,GridLines->Automatic,TernaryPlotCorners->{{0,0},{1,0},{0,1}},PlotStyle->{{PointSize[0.02],Darker@Red}},GridLinesStyle->Darker[Gray],FrameLabel{Style[" Pentane",12,Darker@Green],Style[" Heptane",12,Darker@Green],Style[" Hexane",12,Darker@Green]},ImageSize->400{1,1},ImagePadding->{{80,0},{80,0}}]
Out[]=
In[]:=
plt1=TernaryListPlot[Reverse@tbl1,PlotRange{{0,1},{0,1}},AspectRatio1,GridLines->Automatic,TernaryPlotCorners->{{0,0},{1,0},{0,1}},PlotStyle->{{PointSize[0.02],Darker@Red}},GridLinesStyle->Darker[Gray],FrameLabel{Style[" Pentane",12,Darker@Green],Style[" Heptane",12,Darker@Green],Style[" Hexane",12,Darker@Green]},ImageSize->400{1,1},ImagePadding->{{80,0},{80,0}}];
Calculation of the liquid composition profile in the Stripping Section with 20 Stages. Reboil ratio is equal to 1.35.
In[]:=
S[i_,n_]:=ys[i,n](s+1)/sxs[i,n+1]-b[i]/s(*strippingsectionoperatingline*)
In[]:=
b[1]=0.001;b[2]=0.415459;b[3]=1-b[1]-b[2];(*bottomcomposition*)
In[]:=
s=1.35;(*reboilratio*)
In[]:=
Do[{xs[i,0]=b[i]},{i,1,3}];
In[]:=
Sys3=Table[S[i,n],{i,1,3},{n,0,Ne-1}];
In[]:=
Eq2[i_,n_]:=ys[i,n]xs[i,n]a[i]1/Sum[xs[j,n]a[j],{j,1,3}](*equilibriumrelations*)
In[]:=
Sys4=Table[Eq2[i,n],{i,1,3},{n,0,Ne-1}];
In[]:=
System2=Flatten[Join[Sys3,Sys4]];
In[]:=
unk3=Table[{xs[i,n],0.2},{i,1,3},{n,1,Ne}];
In[]:=
unk4=Table[{ys[i,n],0.5},{i,1,3},{n,0,Ne-1}];
In[]:=
Unknown2=Flatten[Join[unk3,unk4],1]
Out[]=
{{xs[1,1],0.2},{xs[1,2],0.2},{xs[1,3],0.2},{xs[1,4],0.2},{xs[1,5],0.2},{xs[1,6],0.2},{xs[1,7],0.2},{xs[1,8],0.2},{xs[1,9],0.2},{xs[1,10],0.2},{xs[1,11],0.2},{xs[1,12],0.2},{xs[1,13],0.2},{xs[1,14],0.2},{xs[1,15],0.2},{xs[1,16],0.2},{xs[1,17],0.2},{xs[1,18],0.2},{xs[1,19],0.2},{xs[1,20],0.2},{xs[2,1],0.2},{xs[2,2],0.2},{xs[2,3],0.2},{xs[2,4],0.2},{xs[2,5],0.2},{xs[2,6],0.2},{xs[2,7],0.2},{xs[2,8],0.2},{xs[2,9],0.2},{xs[2,10],0.2},{xs[2,11],0.2},{xs[2,12],0.2},{xs[2,13],0.2},{xs[2,14],0.2},{xs[2,15],0.2},{xs[2,16],0.2},{xs[2,17],0.2},{xs[2,18],0.2},{xs[2,19],0.2},{xs[2,20],0.2},{xs[3,1],0.2},{xs[3,2],0.2},{xs[3,3],0.2},{xs[3,4],0.2},{xs[3,5],0.2},{xs[3,6],0.2},{xs[3,7],0.2},{xs[3,8],0.2},{xs[3,9],0.2},{xs[3,10],0.2},{xs[3,11],0.2},{xs[3,12],0.2},{xs[3,13],0.2},{xs[3,14],0.2},{xs[3,15],0.2},{xs[3,16],0.2},{xs[3,17],0.2},{xs[3,18],0.2},{xs[3,19],0.2},{xs[3,20],0.2},{ys[1,0],0.5},{ys[1,1],0.5},{ys[1,2],0.5},{ys[1,3],0.5},{ys[1,4],0.5},{ys[1,5],0.5},{ys[1,6],0.5},{ys[1,7],0.5},{ys[1,8],0.5},{ys[1,9],0.5},{ys[1,10],0.5},{ys[1,11],0.5},{ys[1,12],0.5},{ys[1,13],0.5},{ys[1,14],0.5},{ys[1,15],0.5},{ys[1,16],0.5},{ys[1,17],0.5},{ys[1,18],0.5},{ys[1,19],0.5},{ys[2,0],0.5},{ys[2,1],0.5},{ys[2,2],0.5},{ys[2,3],0.5},{ys[2,4],0.5},{ys[2,5],0.5},{ys[2,6],0.5},{ys[2,7],0.5},{ys[2,8],0.5},{ys[2,9],0.5},{ys[2,10],0.5},{ys[2,11],0.5},{ys[2,12],0.5},{ys[2,13],0.5},{ys[2,14],0.5},{ys[2,15],0.5},{ys[2,16],0.5},{ys[2,17],0.5},{ys[2,18],0.5},{ys[2,19],0.5},{ys[3,0],0.5},{ys[3,1],0.5},{ys[3,2],0.5},{ys[3,3],0.5},{ys[3,4],0.5},{ys[3,5],0.5},{ys[3,6],0.5},{ys[3,7],0.5},{ys[3,8],0.5},{ys[3,9],0.5},{ys[3,10],0.5},{ys[3,11],0.5},{ys[3,12],0.5},{ys[3,13],0.5},{ys[3,14],0.5},{ys[3,15],0.5},{ys[3,16],0.5},{ys[3,17],0.5},{ys[3,18],0.5},{ys[3,19],0.5}}
In[]:=
Length[Unknown2]
Out[]=
120
Stripping profile
The points’ labels indicate the stage number (we count starting from the top).
The points’ labels indicate the stage number (we count starting from the top).
Final composition profile of the ternary ideal mixture of pentane, hexane and heptane. Overall Material Balance is shown as dashed green line joining bottom, distillate and feed. Feed position is indicated by the green point.
We successfully reproduce Fig. 4.3 of Ref. 1. TL indicate the tie-line.
As one can see, node pinches (region in the column where the composition is not changing - shown with a gray pane) appear at the end of both the upper and lower operating lines.
Such node type (i.e., pinch node) are present both for binary mixtures and ternary mixtures (or multicomponent mixtures).
Such node type (i.e., pinch node) are present both for binary mixtures and ternary mixtures (or multicomponent mixtures).
ILLUSTRATION 2
Overall Material Balance gives Bottom composition:
0.0001% Pentane, 41.58% Hexane, 58.4% Heptane
Without loss of generality, we take F = feed flow rate = 1 kmol/hr as a basis.
Overall Material Balance gives Bottom composition:
0.0001% Pentane, 41.58% Hexane, 58.4% Heptane
Without loss of generality, we take F = feed flow rate = 1 kmol/hr as a basis.
Calculation of the liquid composition profile in the Rectifying Section with 20 Stages. Reflux ratio is equal to 2.5.
Rectifying profile.
The points’ labels indicate the stage number (we count starting from the top).
The points’ labels indicate the stage number (we count starting from the top).
Calculation of the liquid composition profile in the Stripping Section with 30 Stages. Reboil ratio is equal to 1.35.
Stripping profile
The points’ labels indicate the stage number (we count starting from the top).
The points’ labels indicate the stage number (we count starting from the top).
Final composition profile of the ternary ideal mixture of pentane, hexane and heptane.
Overall Material Balance is shown as dashed green line joining bottom, distillate and feed.
Feed position is indicated by the green point.
Overall Material Balance is shown as dashed green line joining bottom, distillate and feed.
Feed position is indicated by the green point.
We successfully reproduce Fig. 4.3b of Ref. 1. TL indicate the tie-line. When Bottom purity is set equal to 0.0001% pentane,
As one can see, node pinches (region in the column where the composition is not changing) appear at the end of both the upper and lower operating lines. Such node type (i.e., pinch node) are present both for binary and ternary (or multicomponent mixtures). The node pinch are shown with gray panes.
If we reduce the mole fraction of pentane in the bottom stream (from 0.1% to 0.0001%), the stripping profile first approaches the point (0,0.676,0.324) and then move away from this later point. The composition is essentially constant near this point (shown with red pane). This pinch is called a saddle pinch. This situation is specific to only ternary or multicomponent mixtures (i.e., it does not occur for binary mixtures).
References
References
◼
[1] M. F. Doherty and M. F. Malone, Conceptual Design of Distillation Systems, Boston: McGraw-Hill, 2001.
CITE THIS NOTEBOOK
CITE THIS NOTEBOOK
Effect of Product Purity on Liquid Composition Profiles of a Normal Alkane Mixture
by Housam Binous and Ahmed Bellagi
Wolfram Community, STAFF PICKS, February 4, 2024
https://community.wolfram.com/groups/-/m/t/3115576
by Housam Binous and Ahmed Bellagi
Wolfram Community, STAFF PICKS, February 4, 2024
https://community.wolfram.com/groups/-/m/t/3115576