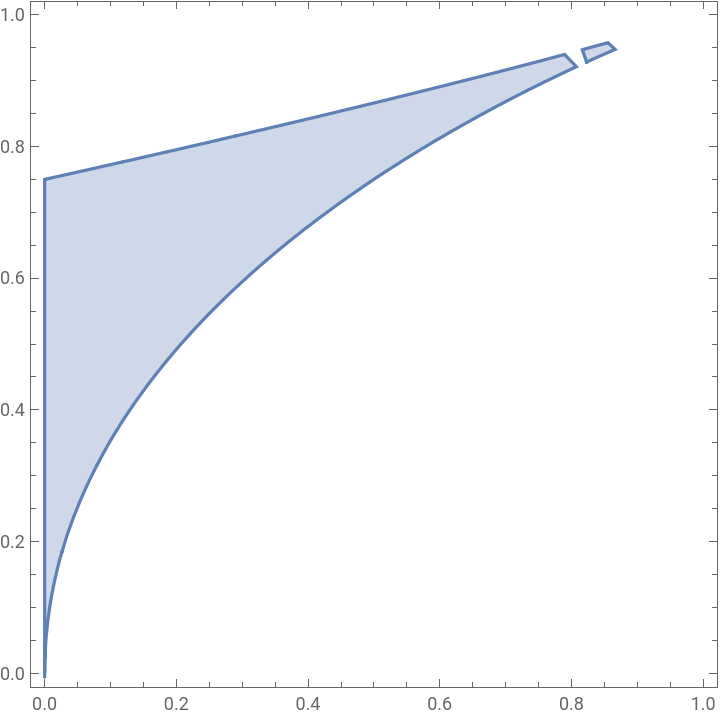
data=;
In[]:=
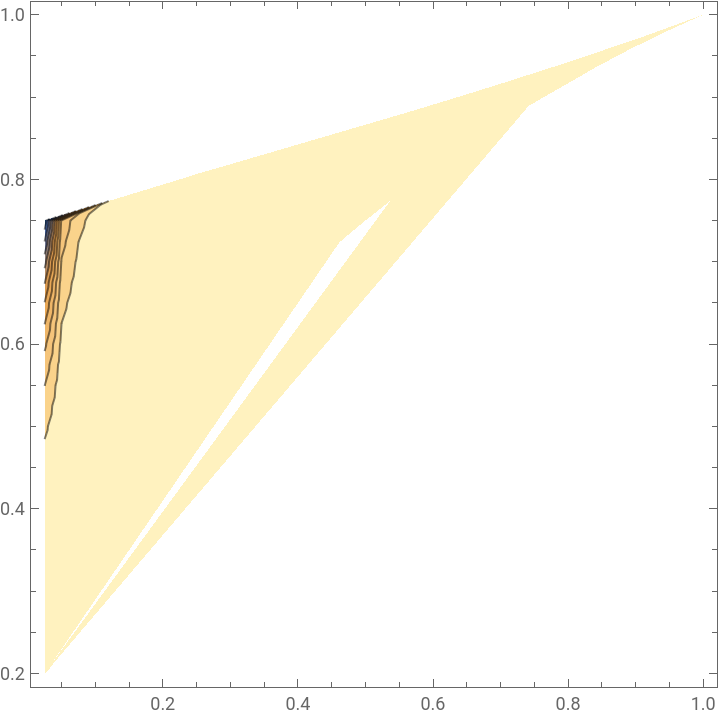
ListContourPlot[data,Contours10,PlotLegendsAutomatic,PlotRangeAll,RegionFunctionFunction[{x,y,z},-21+
1-y
+3+21-y
y<x<-2+21-y
+3y-21-y
y]]Out[]=

In[]:=
ContourPlot[1,{i,0,1},{j,0,1},PlotLegendsAutomatic,PlotRangeAll,RegionFunctionFunction[{x,y,z},-21+
1-y
+3+21-y
y<x<-2+21-y
+3y-21-y
y]]Out[]=

In[]:=
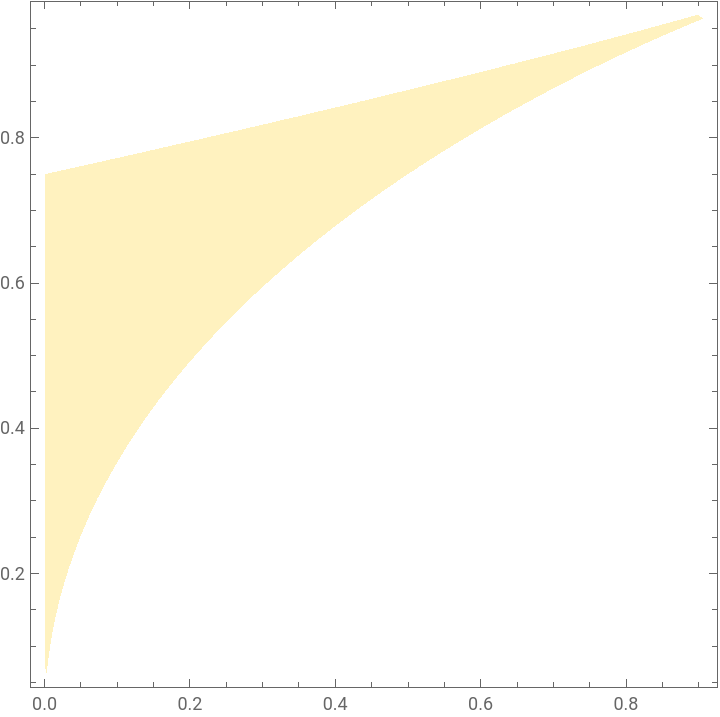
RegionPlot[-21+
1-y
+3+21-y
y<x<-2+21-y
+3y-21-y
y,{x,0,1},{y,0,1},PlotRangeFull]Out[]=