In this project, we explore how students from different countries, continents, and backgrounds are united through their shared passion for Wolfram. Using a dataset of student information and project titles, we examine both the geographic diversity of participants and the evolution of project themes over time. This reveals how certain academic topics rise or fall in popularity across the years.
Beyond these trends, we delve into emotional expression by applying facial emotion recognition to participant profile images. Using dimensionality reduction with FeatureSpacePlot, we visualize how students cluster based on emotional similarities within each academic track. Some tracks exhibit tightly grouped emotional profiles, while others show greater diversity.
Through this combination of geographic, thematic, and emotional analysis, we gain a multi-dimensional understanding of what it means to be part of the Wolfram Summer School. This project invites us to reflect not only on what brings us together, but also on what sets us apart—and to consider, in both expression and spirit, who might be the most “Wolfram” of us all.
Data Preparation
Data Preparation
What Makes Us Different
What Makes Us Different
We begin this reflective journey by embracing our differences. It is only natural for humans to be unique and forge their own paths. That is, after all, what makes us human. But before we can understand ourselves, we must first acknowledge the different backgrounds we come from and how they shape our identities. The journey of reflection does not begin in isolation, it begins in response to the world around us.
Participant Trends
Participant Trends
And so, we begin this story with something simple yet fundamental, the number of participants. It is a fitting place to start, because numbers offer us perspective. Are we part of a large and growing movement, or a small, intimate gathering of minds? Are we continuing a tradition, or part of something new? It is a humbling thought to wonder how many have come before us, walking the halls of Bentley or speaking one-on-one with Stephen Wolfram. Before we define who we are, we must understand how many we are.
Out[]=
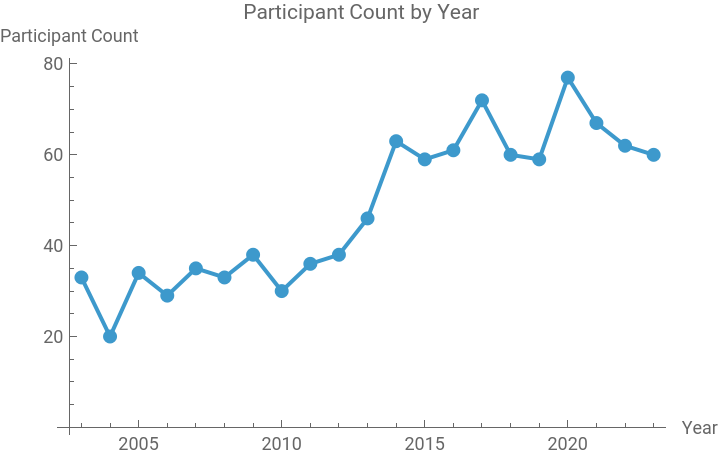
Just as we expected, the number of participants has steadily increased over time, peaking in 2020. This surge may be linked to the global shift toward online programs during the pandemic. Since then, participation has remained steady. But this is not just a graph of numbers, it is a reflection of the growing reach of the Wolfram community. And now that we know how many of us there are, the next question is: who are we?
Affiliation Trends
Affiliation Trends
Now that we know how many of us there are, the next question becomes: who are we?
One of the simplest clues lies in our email addresses, small details that carry more meaning than we might think. They hint at where we come from, the institutions we represent, and whether we walk this journey alone or on behalf of a greater whole. Some participants use personal emails, bringing only themselves. Others use professional or academic ones, signaling that their participation reflects more than personal ambition. It reflects trust, endorsement, and shared purpose.
One of the simplest clues lies in our email addresses, small details that carry more meaning than we might think. They hint at where we come from, the institutions we represent, and whether we walk this journey alone or on behalf of a greater whole. Some participants use personal emails, bringing only themselves. Others use professional or academic ones, signaling that their participation reflects more than personal ambition. It reflects trust, endorsement, and shared purpose.
Out[]=
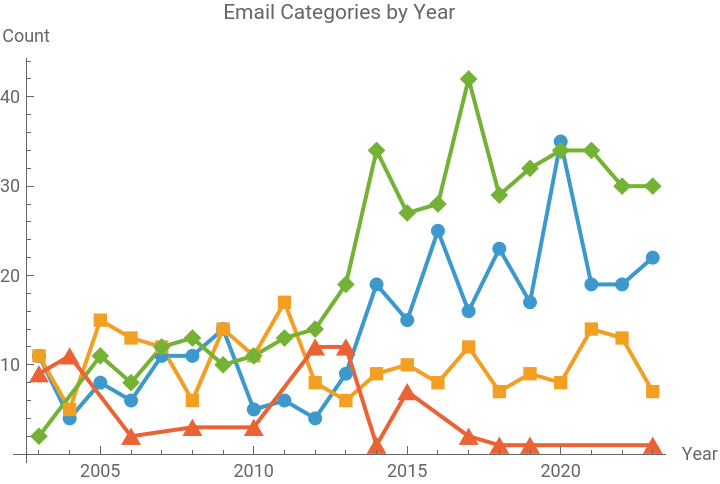


By examining these affiliations, we begin to understand the makeup of the Wolfram community. We see when and how different groups became involved in this shared endeavor. Over time, personal email usage grew, suggesting that many joined out of passion or curiosity rather than formal obligation. At the same time, academic participation steadily rose, shaping the program into a more intellectual hub. Professional affiliations, once strong in earlier years, began to wane, perhaps as individuals took the lead over institutions.
And so we begin to see: the Wolfram story is written not just by organizations, but by people, individuals choosing to take part, whether as students, researchers, or curious minds with no official title.
With that in mind, it’s time to ask the next question: where do we all come from?
And so we begin to see: the Wolfram story is written not just by organizations, but by people, individuals choosing to take part, whether as students, researchers, or curious minds with no official title.
With that in mind, it’s time to ask the next question: where do we all come from?
Continental Distribution
Continental Distribution
So far, we’ve seen who the participants are and what affiliations they bring. But another layer of identity still waits to be explored: where in the world do they come from?
Wolfram is known globally, its reach spans continents, but has that global presence always been reflected in the participants? Has it become easier over time for people across the world to contribute? Or has the experience remained centered in a few regions?
To find out, we grouped participants by continent and visualized how their representation evolved.
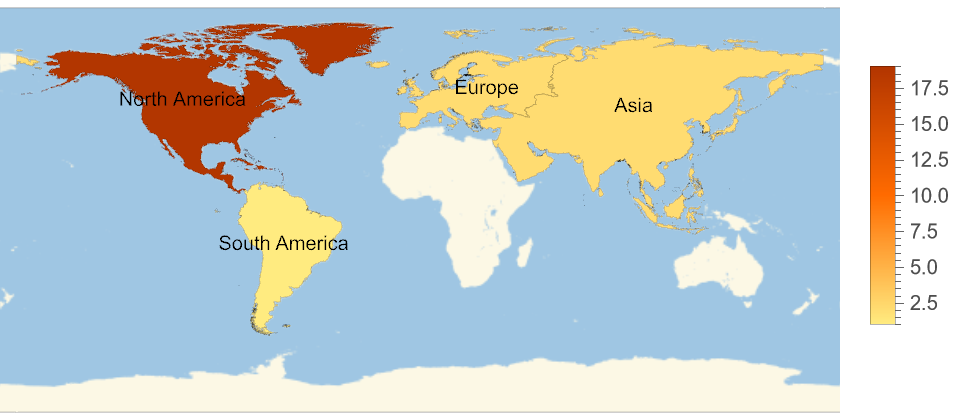
North America leads with the highest number of participants across all years, a likely result of Wolfram’s origin and early outreach. Europe follows closely, with consistent engagement. South America maintains a quieter but steady presence.
Asia, once minimally represented, begins to rise notably after 2015, peaking in 2020 and continuing strong afterward. Australia, too, sees a gradual increase in participation. Meanwhile, Africa, with the lowest early numbers, shows promising growth beginning in 2020.
By 2023, the map tells a powerful story: every continent has a voice. The program, once concentrated, now mirrors a truly global community.
Still, this raises another question. If participation is now global, what about the countries themselves? Which ones contribute the most, and which are just beginning their journey?
Let’s zoom in further.
Countries Distribution
Countries Distribution
Now that we’ve seen the world come into view, let’s zoom in further, to the nations that shape the Wolfram Summer School.
Looking at countries gives us a more balanced view of participation. This isn’t about comparing who contributes more or less, but rather about understanding the spread, and imagining the potential in places we haven’t yet reached. If some countries contribute consistently, that’s encouraging. But when others disappear from the map, we must ask: what opportunities are we missing?
Looking at countries gives us a more balanced view of participation. This isn’t about comparing who contributes more or less, but rather about understanding the spread, and imagining the potential in places we haven’t yet reached. If some countries contribute consistently, that’s encouraging. But when others disappear from the map, we must ask: what opportunities are we missing?
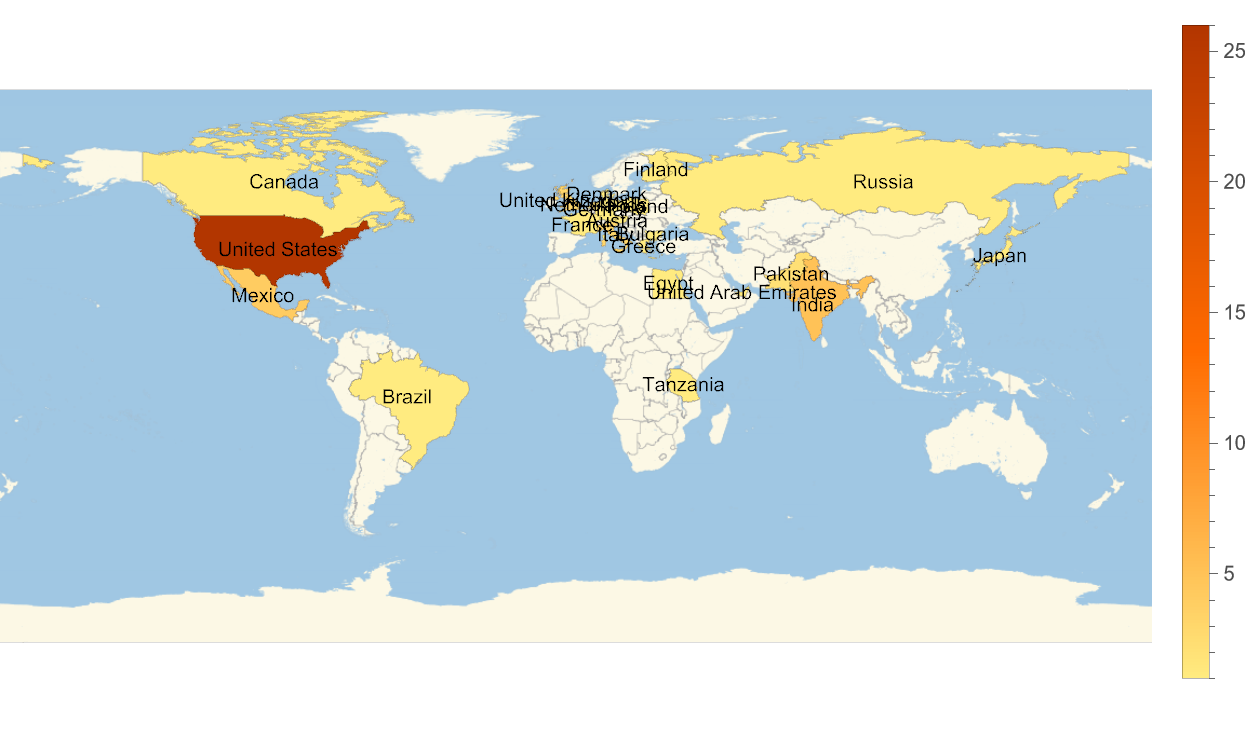
The United States, unsurprisingly, leads the pack — year after year, it brings the most participants. Nearby, Mexico and Brazil emerge as consistent contributors from Latin America. Across the Atlantic, the United Kingdom, Germany, and the Netherlands represent Europe’s strong academic and professional ties to the program.
Asia reveals its own rhythm: India and China lead, joined in recent years by a growing number of students from South Korea, Pakistan, Japan, and the Philippines. Each name on the map carries a story, of access, outreach, and interest.
More recently, we see a heartening trend: participants from underrepresented countries are beginning to appear more frequently. The global reach we imagined at the beginning of this reflection is becoming reality, one country at a time.
And with that, we arrive at a turning point. Now that we know who they are, where they come from, and how they connect, it’s time to ask: what do they bring with them?
Let’s look at the ideas they carried.
Project Themes and Student Tracks Trends
Project Themes and Student Tracks Trends
As we’ve learned who they are and where they come from, a new question emerges:
What ideas did they bring to life?
With each participant comes a project, a glimpse into their curiosity, passion, and ambition. In this section, we explore how those project themes have evolved across two decades. What tracks attracted the earliest thinkers? Which themes grew over time? Which faded away? And do the topics tell us something deeper about the world these students came from?
Trends in Project Themes (Powered by LLM)
Trends in Project Themes (Powered by LLM)
To make sense of the thousands of projects, we trained a large language model to reclassify them into five simplified categories, allowing us to observe broad trends and shifts in interest over time.
Out[]=
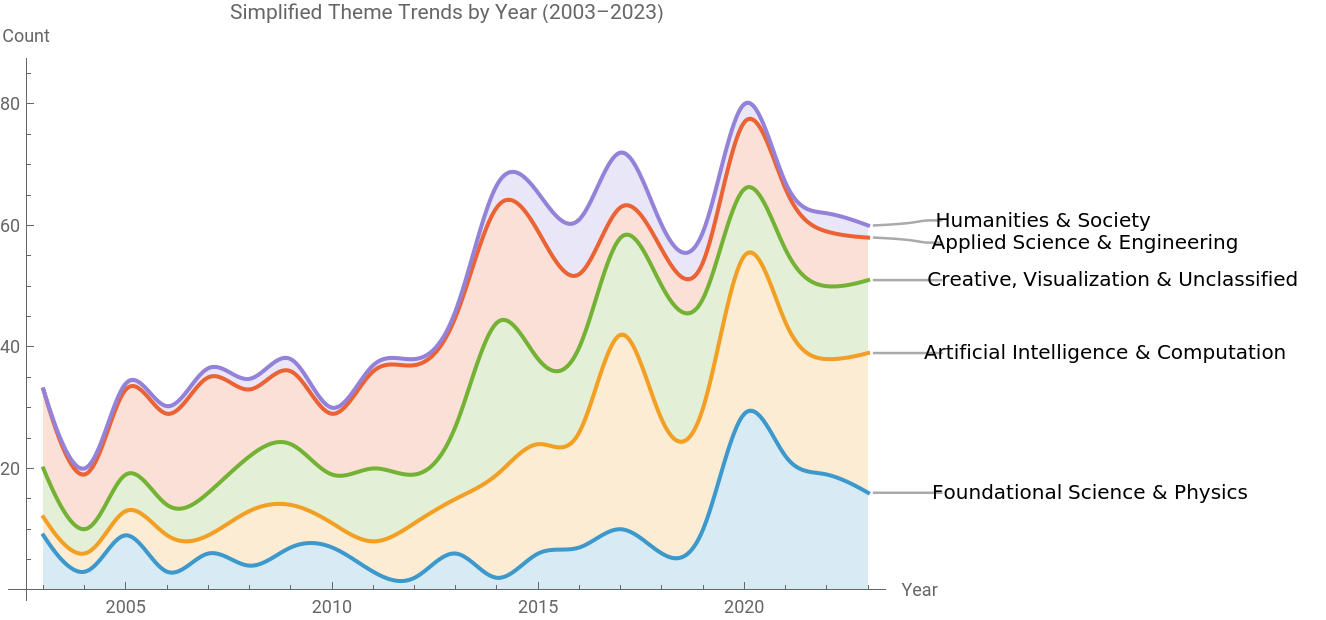
The earliest waves of participation were filled with applied science and engineering, a reflection of Wolfram’s strong roots in mathematics, physics, and computation. These topics remained dominant until around 2015.
Then something shifted. A new era began, as students leaned into Artificial Intelligence and Computation. As the world became more fluent in machine learning, so did the participants, mirroring global shifts in research, education, and imagination.
Foundational Science and Physics held steady, even gaining momentum during the pandemic, perhaps as students returned to the basics of understanding the world. Meanwhile, Creative, Visualization & Unclassified projects danced across the years, rising sharply around 2018 before settling into a quieter rhythm.
And at the edges, often overlooked but always present, were the Humanities & Society projects. Small in number, but growing. These themes represent participants who asked not just what can be built, but why, and for whom.
In short, the projects mirror the times. From equations to ethics, from circuits to stories, every theme reflects the moment it was born in.
Trends in Student Tracks (Powered by LLM)
Trends in Student Tracks (Powered by LLM)
If themes tell us what students worked on, tracks tell us where they belonged.
Looking deeper, we discover that even before tracks were formally introduced, the seeds were already there. Students naturally clustered into certain domains, driven by shared curiosity, research background, or personal mission. Wolfram didn’t create these interests, it caught the wave.
Looking deeper, we discover that even before tracks were formally introduced, the seeds were already there. Students naturally clustered into certain domains, driven by shared curiosity, research background, or personal mission. Wolfram didn’t create these interests, it caught the wave.
Out[]=
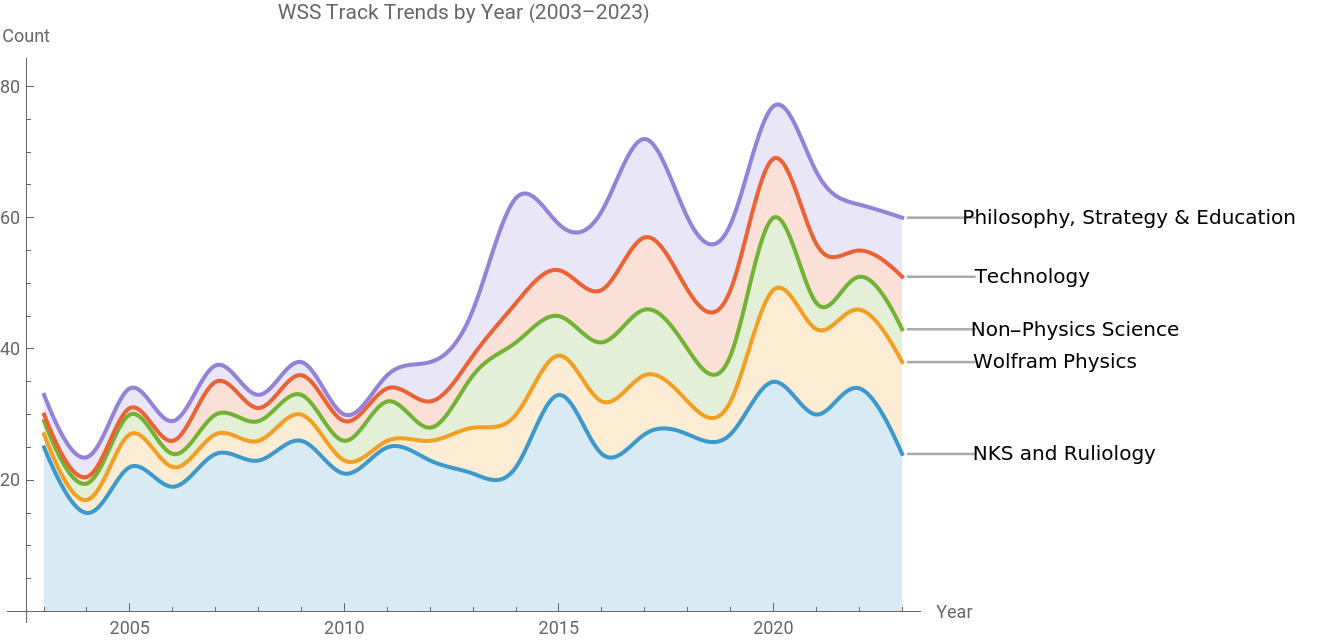
The earliest and most consistent of these was NKS and Ruliology, a foundation built on cellular automata and simple rules. For years, this track formed the backbone of Wolfram Summer School, and even as interests evolved, its presence remained firm.
By the mid-2010s, students began branching out. Wolfram Physics, Non-Physics Science, and Technology emerged with strength, showing the ecosystem’s flexibility to embrace both hard science and applied innovation.
Then, in 2017, a new voice began to grow louder, Philosophy, Strategy & Education. A shift toward interdisciplinary and human-centered thinking took hold. And during the pandemic, participation across nearly all tracks peaked, a potential sign of increased access or reflection during isolation.
What’s striking here is not just the appearance of new tracks, but the coexistence of old and new. The tracks didn’t replace each other. They layered, creating a richer, more complex tapestry.
Wolfram’s track system, in the end, is not rigid. It evolves, absorbs, and reflects the diversity of its participants, and in doing so, it shows us how student interests aren’t just guided, but cultivated over time.
Faces Behind the Data: Participant Identity and Collage Analysis
Faces Behind the Data: Participant Identity and Collage Analysis
Now that we’ve explored everyone’s background and ideas, how they evolve over time, how they ride the trends, we might begin to wonder: are they all really that different?
Could they actually be… similar?
That can’t be right.
From the beginning, I set out to show you how each participant was unique, each one different in their own way.
But the data seems to suggest otherwise. They do seem a little… similar. Maybe even a little bit Stephen Wolfram themselves.
Could they actually be… similar?
That can’t be right.
From the beginning, I set out to show you how each participant was unique, each one different in their own way.
But the data seems to suggest otherwise. They do seem a little… similar. Maybe even a little bit Stephen Wolfram themselves.
Emotional Portrait of a Wolfram Student
Emotional Portrait of a Wolfram Student
As I mentioned before, what better way to capture individuality than through emotion?
Sure, some students share similar emotional profiles, but there’s always that one outlier.
The one who doesn’t quite fit the mold. The one who feels different.
So we ask ourselves:
Stephen on the wall, who is the Wolframest of them all?
Sure, some students share similar emotional profiles, but there’s always that one outlier.
The one who doesn’t quite fit the mold. The one who feels different.
So we ask ourselves:
Stephen on the wall, who is the Wolframest of them all?
Notable Faces(Staff)
Notable Faces(Staff)
We’ve seen how emotions blend into an average—but now we ask: who breaks that mold? In this section, we highlight standout individuals, those whose emotional profiles are farthest from the average. These faces, often vibrant in happiness but carrying unique traces of other emotions, symbolize the individuality at the heart of the Wolfram Summer School.
Take a look at the rankings, not as a competition, but as a celebration of expressive variance. From radiant smiles to subtle signals of surprise or introspection, each participant tells a story beyond the data points.
Their portraits remind us: even in a program defined by computation, it’s the human variation, the joyful outliers, the calmly centered, the unexpectedly expressive, that makes the pattern worth seeing.
Typical vs Atypical: Emotional Signatures per Track
Typical vs Atypical: Emotional Signatures per Track
If the previous section revealed who stands closest and farthest from the emotional average across the entire group, this section drills down even further, per track.
Each track at the Wolfram Summer School represents a unique intellectual community. But do they also show emotional signatures? By comparing students within the same track, we identify:
- The most “typical” student (emotionally closest to their track’s average).
- The most “atypical” student (emotionally farthest from it).
This helps us explore:
- Whether different tracks attract different emotional tones.
- Whether some tracks lean toward neutrality while others express more joy, calm, or even intensity.
- How individual variance plays out within smaller academic groups.
Looking at these faces, we’re reminded that data can smile, stare blankly, or even smirk a little.
The students marked as “typical” aren’t average in any dull sense. Rather, they embody a kind of emotional center for their track, mirroring the general tone, the shared mood, the emotional rhythm of their peers. They reflect how that track feels when it’s being most itself.
Then, there are the outliers, the ones furthest from the average. Their faces whisper a different tone, often more intense or more ambiguous. Maybe they arrived with a different expectation, maybe the moment of the photo was unique, or maybe they’re just naturally expressive. But in every case, they remind us of the diversity that persists even in shared learning spaces.
Together, the pairs of “closest” and “farthest” reveal an emotional fingerprint for each track. The calm of Metamathematics. The optimism of Educational Innovation. The contemplative spark of Philosophy and Strategy. These aren’t just labels; they are emotional textures, each track subtly shaping how students show up, not just in work, but in expression.
So, maybe it’s not about who smiles the most. Maybe it’s about what the smile means in context.
Emotions Are Not Uniform – They Cluster and Scatter by Track
Emotions Are Not Uniform – They Cluster and Scatter by Track
We’ve seen which students stand out emotionally, but what about everyone else? Are emotions shared across students in the same track, or do they vary wildly?
In this section, we zoom out to look at how emotions are distributed within and across tracks. When we group students by their academic focus, fascinating structures emerge. Some tracks form tight emotional clusters, while others scatter widely across the emotional space.
This tells us that while the Wolfram Summer School community is united by purpose, each track carries its own emotional fingerprint, from joyful consistency to surprising outliers.
When we map emotions by track, surprising patterns begin to emerge:
Some tracks form gentle lines
Like “Pre 2016” and “Educational Innovation”, where students’ expressions shift from joyful smiles to calm or serious faces. These tracks seem to attract students with emotionally balanced traits.
Others are scattered
Such as “Technology and Innovation” or “Wolfram Physics”, where there’s no clear pattern. Students in these tracks express a wide range of feelings, from excitement to intensity to ambiguity.
A few stand out dramatically
Tracks like “Metamathematics” or “Educational Computational X” have students that sit far outside the emotional cluster, unusually expressive or just very different from the rest. These outliers might show how unique their emotional styles or images are.
But even in the chaos, we see gravity
Across all tracks, small emotional “clusters” naturally form, pockets where students group by similar expressions, suggesting shared moods, presentation norms, or simply the emotional vibe of each academic tribe.
Mosaic of Minds
Mosaic of Minds
Throughout this journey, we’ve explored how students differ—emotionally, expressively, and even across academic tracks. But what happens when we zoom out? When we step back from the details and look at the whole?
This mosaic does exactly that. It’s not just an image, it’s a convergence. Every pixel is a person, and every person is part of something bigger. Together, they form a face familiar to every Wolfram Summer School student: Stephen Wolfram.
This mosaic does exactly that. It’s not just an image, it’s a convergence. Every pixel is a person, and every person is part of something bigger. Together, they form a face familiar to every Wolfram Summer School student: Stephen Wolfram.
This mosaic does more than reconstruct a face. It symbolizes the idea that Stephen is not only the founder of the program, but also a reflection of the community itself. The students, their work, and their presence form the foundation of Wolfram Summer School.
As the resolution increases, or as the number of students grows, Stephen’s image becomes clearer, but so does the message. What makes this community powerful is not just one person’s vision, but the many individuals who give it life.
Visually and metaphorically, there is a bit of Stephen in all of us, and a part of all of us in Stephen.
Concluding Remarks
Concluding Remarks
So, where does this story end?
We began with faces, with hundreds of them. Each one unique. Each one carrying its own hopes, worries, and spark of curiosity. And as we walked through the data, we found something quietly beautiful: the deeper we looked, the more we saw ourselves, not just as individuals, but as a community.
Over the years, the Wolfram Summer School has grown. From a small, focused group to a global gathering. People now come from every corner of the world, not just to learn, but to build, to explore, to imagine something more.
And while the projects have changed, shifting from cellular automata to AI, from physics to philosophy, the heart hasn’t. What we found wasn’t just a trend or a cluster on a plot. It was the idea that even in our differences, there are patterns. There are shared emotions. Shared ambitions. A shared drive to create.
And maybe that’s what makes this community so rare. It isn’t just built on knowledge or code, it’s built on people willing to look at the world differently, and then build something from what they see.
In the end, we saw that the one constant in all of this, the thread that quietly ties us together, is Stephen’s vision. But this isn’t just his story any more. It’s ours.
Maybe the Stephen...
was the Wolfram we made along the way.
Acknowledgments
Acknowledgments
I would like to thank my mentor, Philip Maymin, for his guidance, encouragement, and insightful feedback throughout this project. His willingness to meet with me every day during the Summer School gave me the motivation to keep going, partly out of excitement and partly because I did not want to disappoint him.
I also want to express my gratitude to Professor Fei Du and Kelvin Mischo. Professor Fei Du introduced me to Wolfram in her class, where she showed a project she created with Kelvin Mischo. I never imagined that I would someday create a project of my own, just like the one I saw in class. That inspiration carried me through my final project in the Data Storytelling course(BDI 513) and eventually led me to the Wolfram Summer School.
I am thankful to the Wolfram Summer School faculty and staff for creating such a welcoming and intellectually engaging environment. Lastly, I want to thank all the participants, whose data, stories, and enthusiasm made this project meaningful and enjoyable.
And Shalna 😉
Cite This Notebook
Cite This Notebook