Take a look at a few satellites. They almost never look “designed” in the way a car or a phone does — they’re all booms, foil, odd asymmetric panels and exposed hardware. So why does each one look exactly the way it does? Because a satellite is about as function-optimized as engineering gets: every panel angle, boom length and gram of mass is the visible result of a long chain of deliberate decisions. You can very nearly read the requirements straight off the hardware. Satellites are one of the clearest examples of systems engineering done right.
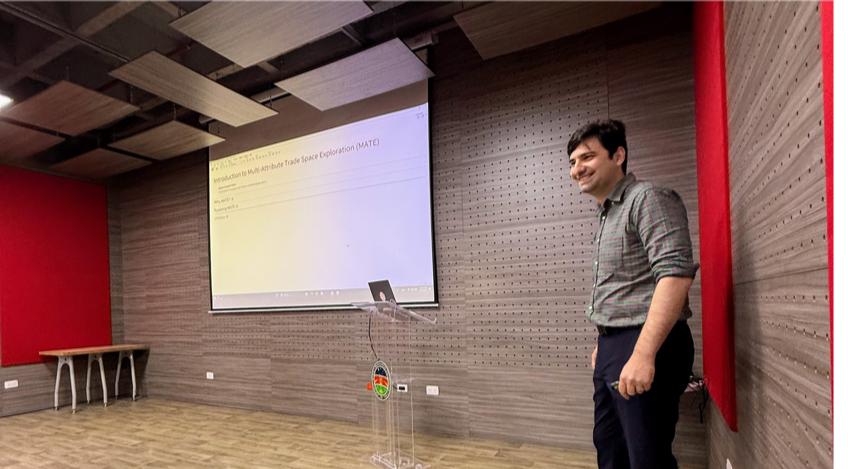
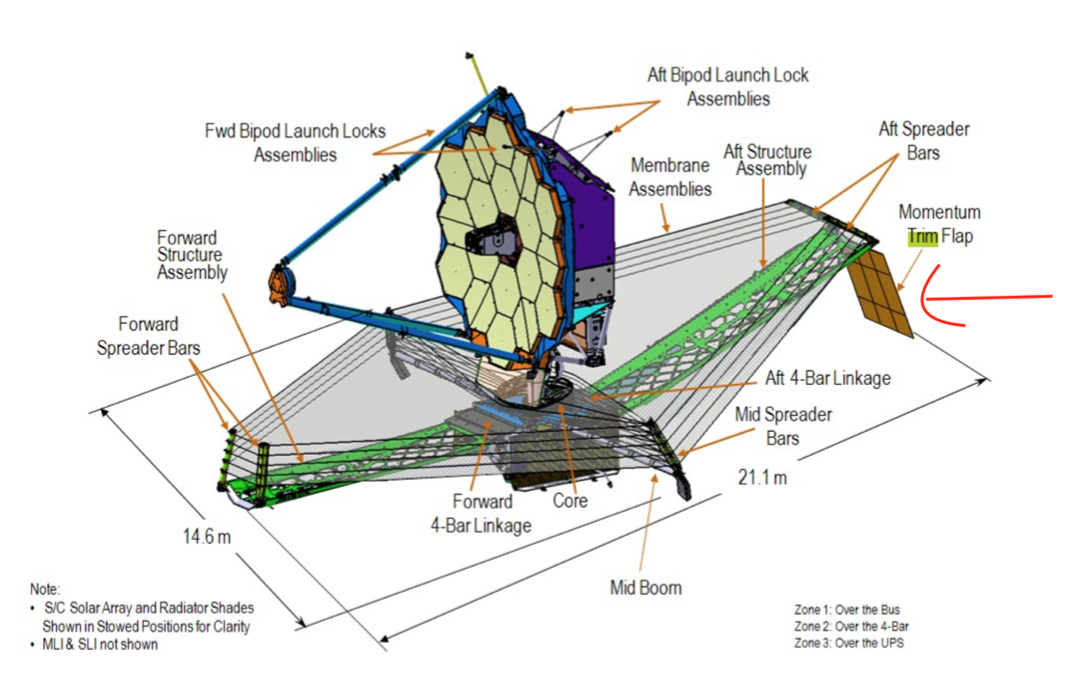
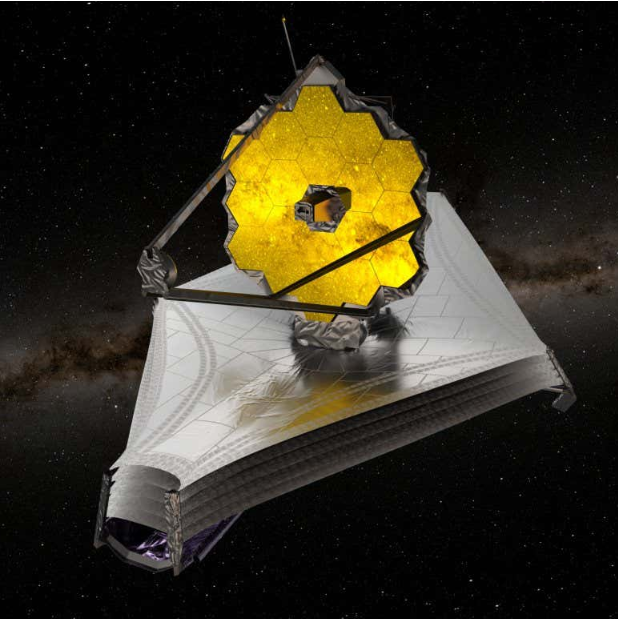
I first started taking this seriously after meeting Jonathan Arenberg, Chief Engineer of the James Webb Space Telescope (pictured below) — a conversation that turned “systems engineering” from a phrase on a slide into something I actually wanted to understand.
I first started taking this seriously after meeting Jonathan Arenberg, Chief Engineer of the James Webb Space Telescope (pictured below) — a conversation that turned “systems engineering” from a phrase on a slide into something I actually wanted to understand.
This notebook accompanies a talk I gave to engineering undergraduates at Universidad Tecnológica de Pereira on 11 March 2025.
Contents
Contents
1
.Introduction to Multi-Attribute Trade Space Exploration
1
.1
.Why do well-engineered systems look the way they do?
1
.2
.What is Systems Engineering? — system, systems thinking, emergence
1
.3
.Why MATE? — framing the design selection problem
2
.Applying MATE — A Space-Tug Satellite Case Study
2
.1
.Case for MATE: the MEV-2 and what a space-tug does
2
.2
.Developing a Value Model: objectives, goals, and attributes
2
.3
.The utility value model: single-attribute utility (SAU) and weights
2
.4
.The multi-attribute utility (MAU) score
3
.Building and Evaluating the Design Space
3
.1
.Design variables and the Design-Value Mapping (DVM)
3
.2
.Reducing a 3840-design space to 96 tractable candidates
3
.3
.Generating and evaluating the model
4
.Results: The Multi-Attribute Trade Space
4
.1
.Cost vs. MAU — the full tradespace
4
.2
.The Pareto frontier: identifying the non-dominated designs
4
.3
.Reading the knee: where to shop on the frontier
5
.References
Why do well-engineered systems look the way they do?
Why do well-engineered systems look the way they do?
◼
Two questions sit underneath almost everything an engineer does: what makes a system good, and how do I choose the best one?
◼
For something like JWST, “good” isn’t a single number — it’s a balance of resolution, mass, cost, schedule and risk, all pulling against each other.
◼
MATE (Multi-Attribute Trade Space Exploration) answers those two questions quantitatively: it lays every candidate design out in one space you can actually compare.
◼
This notebook builds a small MATE study end to end, using a space-tug satellite as the worked example.
What is a good system?
How do I choose the best possible system?
JWSTDiagram |
JWSTDeployed |
A systems engineer!
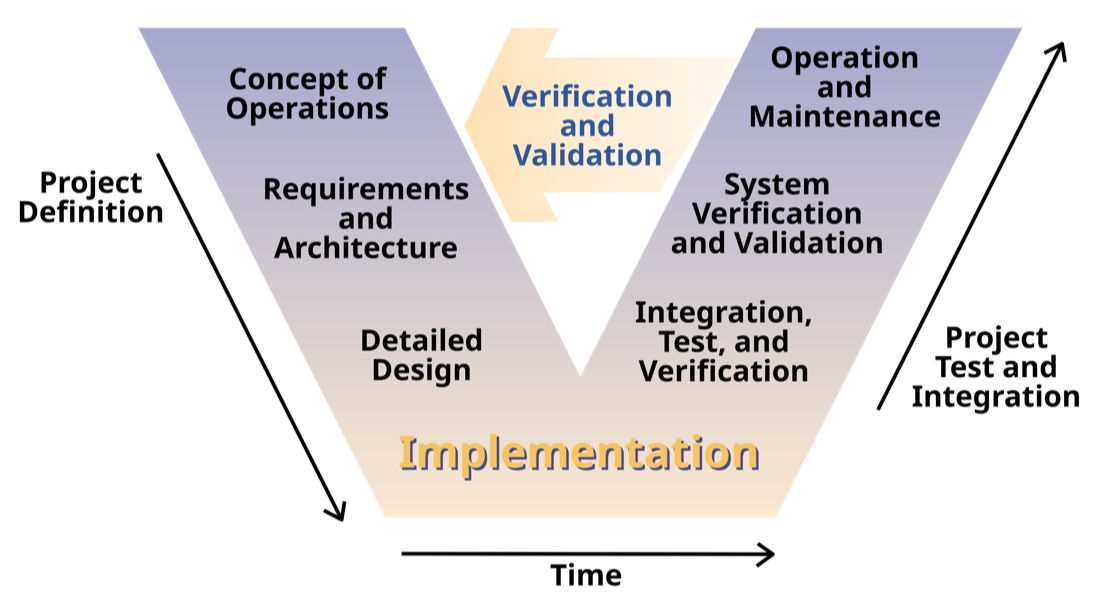
What is Systems Engineering?
What is Systems Engineering?
◼
A system is a set of entities and their relationships, whose functionality is greater than the sum of individual entities.
◼
Systems Thinking is the understanding of a system by examining the linkages and interactions between the components that comprise the entirety of that defined system.
◼
Emergence refers to what appears, materializes, or surfaces when a system operates. Obtaining the desired emergence is why systems are built. Understanding emergence is the goal – and the art – of systems thinking.
In[]:=
RasterizeGraphPlot,,Background->White,RasterSize->500
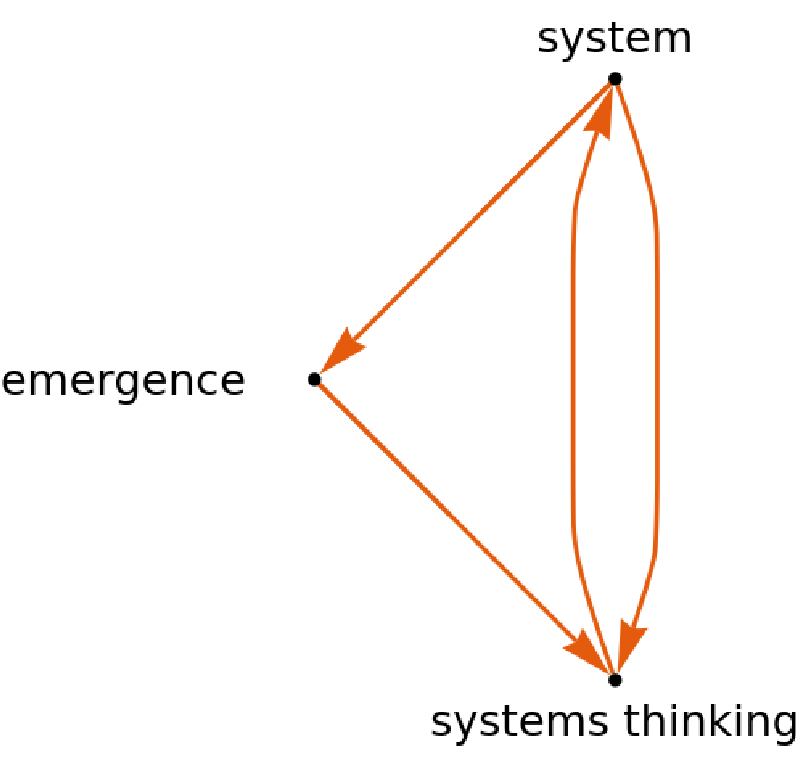
— even the definition of systems engineering is itself a small system. The concepts link into each other rather than sitting in a list.
Applying MATE
Applying MATE
Why MATE?
Why MATE?
Apply MATE to find the best design for a space-tug satellite
What does a space-tug do?
◼
We now run MATE on a concrete problem: choosing the best design for a space-tug — a satellite whose job is to rendezvous with other satellites and move them.
◼
Real-world example pictured: Northrop Grumman’s MEV-2 (Mission Extension Vehicle), shown in the cleanroom and docked on orbit.
Developing a Value Model
Developing a Value Model
Before comparing designs, we need a precise definition of “good.” That’s the value model.
It starts from a one-line value proposition and decomposes top-down into measurable attributes.
It starts from a one-line value proposition and decomposes top-down into measurable attributes.
Value proposition
Value proposition
Meet customer demands (performance and cost) as best as possible, for as long as possible
Decomposition of value proposition
Decomposition of value proposition
◼
Objectives list:
◼
Maximize customer satisfaction
◼
Maximize service life
◼
Minimize cost
◼
Goals list:
◼
Meet mission needs
◼
Long service life
◼
Low cost
◼
Attributes:
◼
ΔV (m/s)
◼
Servicing capability (ordinal)
◼
Response time (categorical)
◼
Operational lifetime (yrs.)
The most important performance attributes:
The most important performance attributes:
◼
Delta-V (ΔV): amount of ΔV a space-tug can impart onto a target
◼
Capability: number of space-tug operations possible within its lifetime
◼
Response time: rate at which it can perform a space-tug operation or switch modes
The utility value model:
The utility value model:
◼
A raw value (8 km/s of ΔV) can’t be compared directly to another kind (a “fast” response). So we convert each to a single-attribute utility (SAU): a 0–1 score where 0 = useless and 1 = fully satisfies the customer.
◼
sauDV, sauCap, sauRespT encode how much the customer values each level of each attribute.
◼
The three curves are deliberately non-linear — the first few km/s of ΔV buy a lot of utility; past a point, you get diminishing returns.
Specify the single-attribute utility (SAU) weights for each design attribute:
Assign weight to each attribute:
◼
Not all attributes matter equally. We assign weights (ΔV 0.6, capability 0.3, response time 0.1) that sum to 1, reflecting the customer’s priorities.
◼
The pie chart just visualizes that: for this customer, ΔV dominates.
The weights add up to 1:
The multi-attribute utility (MAU) score is the weighted sum of SAU scores:
◼
The MAU collapses the separate utilities into one number per design: a weighted sum of the SAU scores.
◼
We interpolate each SAU curve so we can score any value, not just the handful we defined, then dot it with the weights.
◼
modelMAU[9, 2, 1] = 0.735 is a sanity check: 9 km/s ΔV, capability 2, fast response → 0.735 out of 1.
The dot product of the SAU with the interpolated values of a model’s attribute values:
Test a model:
Generate Design Variables Using a Design-Value Mapping (DVM):
Generate Design Variables Using a Design-Value Mapping (DVM):
Some design variables that drive the attributes could be:
◼
Payload: dry weight of the satellite system
◼
Propulsion type: type of fuel used
◼
Fuel level: fuel mass in kg
The design space is quite large!
The reduced design space:
Generate and Evaluate the Model
Generate and Evaluate the Model
This section turns each design into its attribute values. The dependency graph shows how design variables flow through intermediate quantities (bus mass, dry mass, Isp…) into the four final attributes.
◼
The constants and per-propulsion-type variables (biprop, cryo, electric, nuclear) set the physics. The propulsion trade is the heart of the study: high-Isp electric/nuclear deliver more ΔV but weigh more and respond slower.
◼
The generative model functions implement that physics — including the rocket equation for ΔV — mapping any design to {ΔV, capability, response time, cost}.
Relationship between design variables and model attributes:
Relationship between design variables and model attributes:
A graph of the relationship between the design variables and the model attributes:
Model constants:
Model constants:
Associated variables:
Associated variables:
The generative model:
The generative model:
Design Value Assessment
Design Value Assessment
◼
computeValues bundles the whole chain: feed in a design, get back its four attributes.
◼
We run it across all 96 designs, score each with modelMAU, and pair MAU against cost — the two axes that decide everything.
The multi-attribute trade-space
The multi-attribute trade-space
◼
This is the entire point of MATE: all 96 designs plotted as utility (MAU) vs. cost.
◼
Read it like a purchase decision — you want to be high (more value) and to the left (less cost).
◼
The designs along the upper-left edge form the Pareto front: you can’t gain utility without paying more, or pay less without losing utility. Everything below that edge is dominated — some other design beats it on both axes.
◼
The “knee” of the front, where utility stops climbing much per extra dollar, is usually where the best-value design lives. That, finally, is how you choose the best possible system.
The full model list:
Picking the best design
Picking the best design
The Pareto frontier is the set of designs that are not dominated by any other.
◼
Every design not on the frontier is off the table. Each one is beaten by some frontier design that’s both cheaper and higher-utility — so there’s never a reason to pick it. The black staircase is the entire shortlist; the other ~80 designs are just visual context for why these won.
◼
The frontier reframes the decision from “which design?” to “how much am I willing to pay?” Moving up the staircase always costs more for more utility — that’s the trade you can’t escape. The knee, where the curve flattens and each extra dollar buys little additional utility, is the natural sweet spot: beyond it you’re overpaying for marginal gains, before it you’re leaving cheap utility on the table.
Obtain the Pareto frontier points:
MATE took us from a vague “build a good space-tug” to a defensible, quantitative recommendation.
The same five moves — value model → design variables → DVM → evaluate → explore the tradespace — apply to almost any early-stage design problem, not just satellites.
The same five moves — value model → design variables → DVM → evaluate → explore the tradespace — apply to almost any early-stage design problem, not just satellites.
References
References
◼
[1] A. M. Ross and D. E. Hastings, “The Tradespace Exploration Paradigm,” INCOSE International Symposium, vol. 15, no. 1, 2005. seari.mit.edu
◼
[2] A. M. Ross, “Multi-Attribute Tradespace Exploration with Concurrent Design as a Value-Centric Framework for Space System Architecture and Design,” S.M. Thesis, MIT, Cambridge, MA, 2003.
◼
[3] INCOSE, Systems Engineering Handbook: A Guide for System Life Cycle Processes and Activities, 5th ed. Hoboken, NJ: Wiley, 2023.
◼
[4] R. de Neufville and S. Scholtes, Flexibility in Engineering Design. Cambridge, MA: MIT Press, 2011. (optional — only if you want a reference for the utility/value-model thinking)
◼
[5] Northrop Grumman, “Mission Extension Vehicle (MEV),” product overview. (source for the MEV-2 case and imagery)
CITE THIS NOTEBOOK
CITE THIS NOTEBOOK
Introduction to Multi-Attribute Trade Space Exploration (MATE)
by Maher Kuzbari Mora
Wolfram Community, STAFF PICKS, June 17, 2026
https://community.wolfram.com/groups/-/m/t/3735047
by Maher Kuzbari Mora
Wolfram Community, STAFF PICKS, June 17, 2026
https://community.wolfram.com/groups/-/m/t/3735047