Abstract
Abstract
Automatic labeling in visualization
◼
Where is automatic labeling used?
◼
Why automation?
◼
What is automated?
◼
How is it automated?
◼
When was it rolled out?
Where is labeling used?
Where is labeling used?
Applications of automatic labeling
Applications of automatic labeling
◼
Map
GeoGraphics
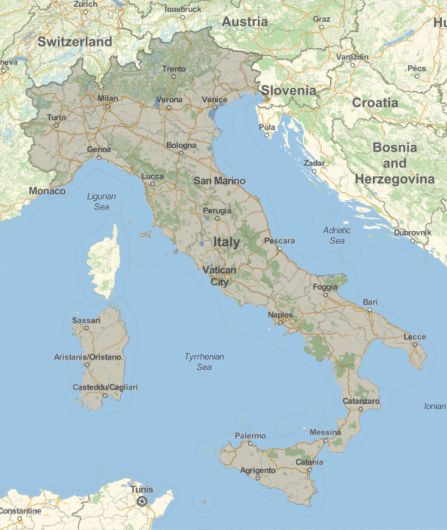
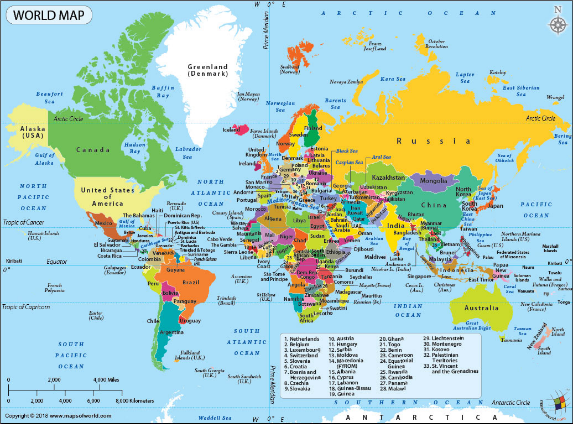
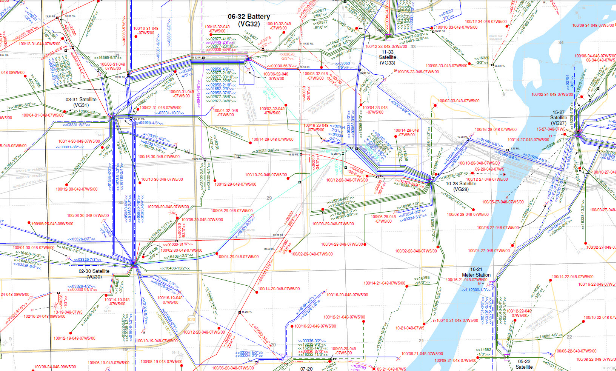
◼
Data Analysis
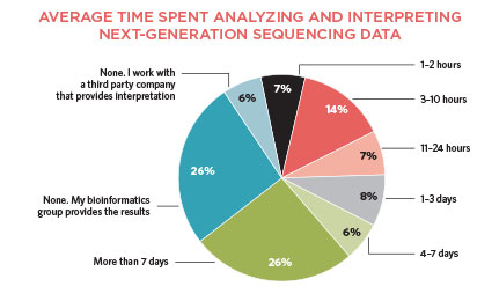
◼
Scientific Plots
◼
Anatomy
Why Automation?
Why Automation?
◼
Free-hand labeling can be time consuming and hard to reproduce.
◼
Without an algorithmic method, labels can collide with each other and become hard to read.
◼
Using low level Text to add labels requires post-processing of the plots.
◼
Free-hand labeling can distract from the process of data exploration.
What is automated?
What is automated?
Data
Data
◼
Categorical data
◼
Meta data
Options
Options
◼
PlotLabels
◼
LabelingFunction
◼
PlotHighlighting
◼
ChartLabels
Wrapper
Wrapper
◼
Callout
◼
Labeled
◼
Highlighted
Categorical data
Categorical data
◼
BubbleChart
◼
ParallelAxisPlot
2D and 3D Point Labeling
2D and 3D Point Labeling
Labeling In Charts
Labeling In Charts
How?
How?
Methods of implementation of automatic labeling
When is it rolled out?
When is it rolled out?
◼
Timeline of labeling
Showcases
Showcases
Callout Appearance
Callout Appearance
CITE THIS NOTEBOOK
CITE THIS NOTEBOOK
Wolfram R&D LIVE: Labeling Everywhere
by MinHsuan Peng
Wolfram Community, STAFF PICKS, September 6, 2023
https://community.wolfram.com/groups/-/m/t/3007543
by MinHsuan Peng
Wolfram Community, STAFF PICKS, September 6, 2023
https://community.wolfram.com/groups/-/m/t/3007543