Main data source: https://v23.proteinatlas.org/
Introduction
Introduction
◼
The Human Protein Atlas is one of the most comprehensive datasets that aims to map all the human proteins in cells, tissues, and organs.
◼
A large portion of the data is based on transcriptomics analysis or the expression levels of different human genes.
◼
The relevant publications have been cited over 20000 times and have been covered in numerous news articles.
◼
The Human Protein Atlas WDR is based on The Human Protein Atlas version 23.0 and Ensembl version 109.
◼
The current version of the WDR covers the Tissue Atlas, Brain Atlas, Pathology Atlas, Single Cell Atlas, and Subcellular Atlas.
◼
The default content is an containing the expression levels (nTPM) of genes in different human tissues along with these additional data:
◼
"TissueAtlas Gene co-expression network" | graphofco-expressinggenesintissues |
"TissueAtlas maximum expression location" | maximum expression location of genes |
"BrainAtlas gene expression (TPM)" | expression levels (TPM) of genes in the human brain |
"BrainAtlas gene expression (pTPM)" | expression levels (pTPM) of genes in the human brain |
"BrainAtlas gene expression (nTPM)" | expression levels (nTPM) of genes in the human brain |
"BrainAtlas Gene co-expression network" | graph of co-expressing genes in the human brain |
"PathologyAtlas" | data about roles of genes in different cancers |
"SingleCellAtlas expression (nTPM)" | expression levels (nTPM) of genes in different cell types |
"SingleCellAtlas cell clusters" | description of cell clusters |
"SingleCellAtlas expression in cell clusters(nTPM)" | expression levels (nTPM) of genes in different cell types and clusters |
"SingleCellAtlas UMAP coordinates in tissue "<> tissue | UMAP coordinates for cells in clusters for different tissues |
"SubCellularAtlas" | expressionofgenesindifferentsubcellularregions |
"Ensembl ID gene name association" | |
"Ensembl ID gene description UniProtID association" | AssociationofEmsemblIDsofgenestogenedescriptionandUniProtID |
"Organ tissue association" | Association of organs and tissues belonging to an organ |
In this notebook I analyze the data in the Human Protein Atlas WDR using the functionalities of Wolfram Language to show the possibilities in research and education.
Some basic definitions
Some basic definitions
◼
TPM: Transcripts Per Million (TPM) is a normalization method for RNA-seq, interpreted as “out of every 1,000,000 RNA molecules in the sample, x originated from this gene or transcript.”
◼
nTPM: normalized Transcripts Per Million. According to the Human Protein Atlas - “All TPM values per sample were scaled to a sum of 1 million TPM (denoted pTPM) to compensate for the non-coding transcripts that had been previously removed. Next, all TPM values of all samples within each data source (HPA + GTEx human tissues, HPA immune cell types, HPA cell lines) were normalized separately using Trimmed mean of M values (TMM) to allow for between-sample comparisons. The resulting normalized transcript expression values, denoted nTPM, were calculated for each gene in every sample. nTPM values below 0.1 are not visualized on the Atlas sections. ”
◼
pTPM: protein-transcripts per million
◼
Kaplan-Meier curve: Kaplan-Meier curves can be used to analyze the difference in survival probabilities between two sets of population. This video gives an excellent demonstration of how meaningful information can be extracted from Kaplan-Meier curves.
◼
Gene co-expression network: networks of genes with high correlation between their expression patterns.
◼
Gene Ontology: The Gene Ontology (GO) knowledgebase is the world’s largest source of information on the functions of genes.
Expression in human tissues
Expression in human tissues
This default dataset contains the normalized transcript expression levels (nTPM) of 20162 genes in 50 human tissues. According to the Human Protein Atlas:
"Consensus transcript expression levels summarized per gene in 50 tissues based on transcriptomics data from HPA and GTEx. The consensus normalized expression (" nTPM ") value is calculated as the maximum nTPM value for each gene in the two data sources. For tissues with multiple sub-tissues (brain regions, lymphoid tissues and intestine) the maximum of all sub-tissues is used for the tissue type."
◼
The data is an association containing the expression levels of genes (given by their Ensembl ID) in 50 tissues:
In[]:=
data=ResourceData["Human Protein Atlas"];
In[]:=
Dataset@data
Out[]=
These are the tissues for which the expression data is available:
In[]:=
tissues=data["Gene"]
Out[]=
{Adipose tissue,Adrenal gland,Amygdala,Appendix,Basal ganglia,Bone marrow,Breast,Cerebellum,Cerebral cortex,Cervix,Choroid plexus,Colon,Duodenum,Endometrium,Epididymis,Esophagus,Fallopian tube,Gallbladder,Heart muscle,Hippocampal formation,Hypothalamus,Kidney,Liver,Lung,Lymph node,Midbrain,Ovary,Pancreas,Parathyroid gland,Pituitary gland,Placenta,Prostate,Rectum,Retina,Salivary gland,Seminal vesicle,Skeletal muscle,Skin,Small intestine,Smooth muscle,Spinal cord,Spleen,Stomach,Testis,Thymus,Thyroid gland,Tongue,Tonsil,Urinary bladder,Vagina}
Ensembl IDs of genes for which the data is available:
In[]:=
ensemblIDs=(Keys@data)[[2;;-1]]
Out[]=
There are a total 20162 genes in this dataset:
In[]:=
Length@ensemblIDs
Out[]=
20162
The common gene names corresponding to an Ensembl ID can be obtained using the “Ensembl ID gene name association” data. Here are the common gene names for the genes in the dataset:
In[]:=
ensGeneAssoc=ResourceData["Human Protein Atlas","Ensembl ID gene name association"];genes=ensGeneAssoc/@ensemblIDs
Out[]=
Let us also get the gene name to Ensembl ID Association, because most data is organized by Ensembl ID and we will need to go back and forth between the two:
In[]:=
geneEnsAssoc=AssociationThread[genes,ensemblIDs];
◼
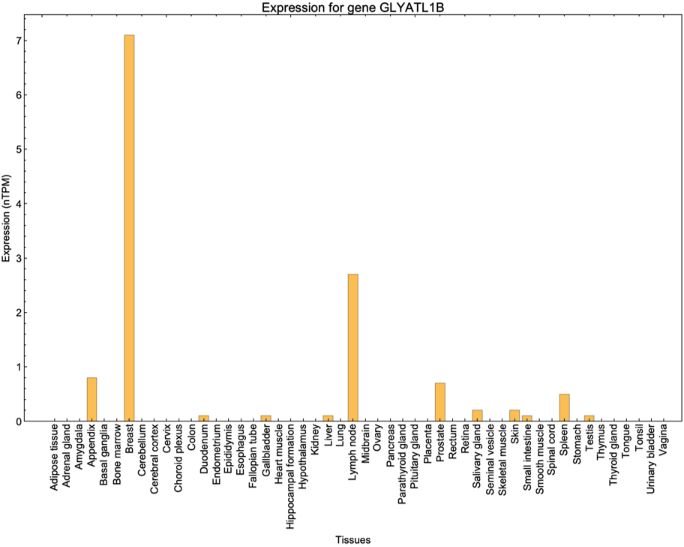
Code to visualize the expressions of a gene:
◼
Expression of a randomly chosen gene:
In[]:=
tissueExpressionPlot[RandomChoice@genes]
Out[]=
Let us visualize the expression of 50 highest expressing genes (in terms of total nTPM) in human tissues:
Gene co-expression network in tissues
Gene co-expression network in tissues
Construction of the gene co-expression network
Construction of the gene co-expression network
We now have the expression data for ~20000 genes in 50 different tissues. For each given pair of genes we can find the correlation in expression and visualize their expression patterns:
◼
Plot and analysis
Here is the plot of the expression of gene pairs and their correlation:
But there are some gene pairs with significant positive correlation (greater than 0.7), which are likely to express together. The network of such gene pairs is can be obtained from the “TissueAtlas Gene co-expression network”:
The network is a list of undirected edges connecting pairs of highly correlated genes. We convert this network to a graph and see the number of nodes and edges:
Let us visualize the co-expression of the gene pairs in a randomly chosen edge:
Subgraph of randomly chosen genes
Subgraph of randomly chosen genes
Here is a scaled subgraph of randomly chosen 30 genes in the co-expression networks in tissues:
◼
Plot
Scale-free nature of the network
Scale-free nature of the network
Many real world networks like the world wide web or citation patterns in science are scale-free, i.e. the degree of connectivity follows a power law distribution. These networks have a few hubs which are highly connected to other nodes. Here we visualize the scale-free nature of the tissue gene co-expression network using ResourceFunction[“VertexDegreeRelativeFrequencies”]:
For small values of the connectivity the decay is slower (power law exponent of -1/2) compared to that of large values (power law exponent of -1).
The nodes in a graph can have different measures that can indicate their relative importance in the network. Here we calculate and visualize some of these measures of the genes in the co-expression network (this step takes more than 12 minutes since the network is a very large one):
From the plot, it seems like there are only a few genes in the network that have high values of different graph-related measures (VertexDegree, BetweennessCentrality, EigenvectorCentrality, and LocalClusteringCoefficient). It will be interesting to explore the biological significance of these genes.
Expression in the human brain
These are the expression levels of genes in different units (TPM, nTPM, pTPM) in different regions of the human brain:
Locations in the human brain for which data is available:
◼
Plot
◼
Plot
◼
Plot
Gene co-expression network in the brain
Gene co-expression network in the brain
Here are the number of nodes and edges in the network:
Scale-free nature of the network
Scale-free nature of the network
Here we visualize the scale-free nature of the brain gene co-expression network using ResourceFunction[“VertexDegreeRelativeFrequencies”]:
Comparing different graph measures between the common genes in the “TissueAtlas Gene co-expression network” and “BrainAtlas Gene co-expression network”
Comparing different graph measures between the common genes in the “TissueAtlas Gene co-expression network” and “BrainAtlas Gene co-expression network”
Here are the common genes involved in the “TissueAtlas Gene co-expression network” and “BrainAtlas Gene co-expression network”:
Get rid of Missing values:
◼
Graph measures for the “BrainAtlas Gene co-expression network”:
◼
Graph measures for the “TissueAtlas Gene co-expression network”:
◼
Genes involved in “BrainAtlas Gene co-expression network”:
◼
Genes involved in “TissueAtlas Gene co-expression network”:
◼
Creating associations of genes in the network and different centrality measures:
◼
Plot for comparing VertexDegrees
Color-code each gene by in both the networks by its location of maximum expression:
◼
Visualize different graph measures
◼
Plot for comparing BetweennessCentralitys
◼
Plot for comparing EigenvectorCentralitys
◼
Plot for comparing LocalClusteringCoefficients
Expression in single cells
Expression in single cells
Data for the expression levels (nTPM) of genes in different human cell types can be obtained by:
These are the different cell types:
Let us visualize the expression levels for a given gene (nPTM) in different kinds of cells:
◼
Plot
Let us visualize which genes has the highest total expressions across different cell types:
Expression in subcellular regions
Expression in subcellular regions
Data of genes in different subcellular regions:
Features of the data:
Role of genes in human cancers
Role of genes in human cancers
Data about roles of genes in different cancers:
From the Human Protein Atlas: “Staining profiles for proteins in human tumor tissue based on immunohistochemistry using tissue micro arrays and log-rank P value for Kaplan-Meier analysis of correlation between mRNA expression level and patient survival. The tab-separated file includes Ensembl gene identifier (“Gene”), gene name (“Gene name”), tumor name (“Cancer”), the number of patients annotated for different staining levels (“High”, “Medium”, “Low” & “Not detected”) and log-rank p values for patient survival and mRNA correlation (“prognostic - favorable”, “unprognostic - favorable”, “prognostic - unfavorable”, “unprognostic - unfavorable”). The data is based on The Human Protein Atlas version 23.0 and Ensembl version 109.”
◼
Genes whose higher expression leads to lower(higher) survival rate in cancer patients with a particular cancer are involved in unfavorable(favorable) prognosis of that cancer.
Here are the number of genes in this dataset
Here is the pathology data for twenty different cancer types for gene CCT4:
Ensembl IDs of genes which are linked to unfavorable & favorable prognosis in different human cancers
Ensembl IDs of genes which are linked to unfavorable & favorable prognosis in different human cancers
Genes involved in unfavorable and favorable prognosis of breast cancer
Genes involved in unfavorable and favorable prognosis of breast cancer
Unfavorable prognosis
Favorable prognosis
Genes most frequently implicated in favorable & unfavorable prognosis in human cancers
Genes most frequently implicated in favorable & unfavorable prognosis in human cancers
Genes involved in favorable and unfavorable prognosis in cancer
Genes involved in favorable and unfavorable prognosis in cancer
Let us see the genes involved in favorable and unfavorable prognosis in individual cancers, scaled by inverse of the log-rank p values for patient survival and mRNA correlation. So larger the size the stronger the correlation:
◼
Plot
Cell cluster map in tissues based on their expression levels
Cell cluster map in tissues based on their expression levels
◼
The clustering is based on this paper: Becht, Etienne, et al. “Dimensionality reduction for visualizing single-cell data using UMAP.” Nature biotechnology 37.1 (2019): 38-44.
Here is the list of tissues for which the clusters are available:
◼
Plot
We can see that the brain has 40 distinct cell clusters.
Plot the clusters of all tissues
Plot the clusters of all tissues
◼
Plot
Citations
Citations
◼
Uhlén M et al., Tissue-based map of the human proteome. Science (2015) PubMed: 25613900 DOI: 10.1126/science.1260419
◼
Uhlen M et al., A genome-wide transcriptomic analysis of protein-coding genes in human blood cells. Science. (2019) PubMed: 31857451 DOI: 10.1126/science.aax9198
◼
Uhlén M et al., The human secretome. Sci Signal. (2019) PubMed: 31772123 DOI: 10.1126/scisignal.aaz0274
◼
Becht, Etienne, et al. "Dimensionality reduction for visualizing single-cell data using UMAP." Nature biotechnology 37.1 (2019): 38-44.
◼
Sjöstedt E et al., An atlas of the protein-coding genes in the human, pig, and mouse brain. Science. (2020) PubMed: 32139519 DOI: 10.1126/science.aay5947
◼
Sjöstedt E et al., An atlas of the protein-coding genes in the human, pig, and mouse brain. Science. (2020) PubMed: 32139519 DOI: 10.1126/science.aay5947
◼
Karlsson M et al., A single-cell type transcriptomics map of human tissues. Sci Adv. (2021) PubMed: 34321199 DOI: 10.1126/sciadv.abh2169
CITE THIS NOTEBOOK
CITE THIS NOTEBOOK
Analyzing and visualizing The Human Protein Atlas data in Wolfram Language
by Soutick Saha
Wolfram Community, STAFF PICKS, December 6, 2024
https://community.wolfram.com/groups/-/m/t/3334474
by Soutick Saha
Wolfram Community, STAFF PICKS, December 6, 2024
https://community.wolfram.com/groups/-/m/t/3334474