This project investigates the behavior of both discrete and continuous random walks on graphs, using simulations to compute probabilities of the walker occupying a given node during the walk, as well as the probability of the walker ending the walk on a given node. In a discrete random walk, the walker moves from one vertex to an adjacent one, with the choice of the next vertex determined by randomly choosing an edge incident to the previous vertex, where the edge weights determine the probability of that edge being chosen. In a continuous random walk, the walker again moves from one vertex to an adjacent one, this time according to a Poisson process determined by edge weights, where if the walker occupies a given vertex at time t, they move along the next incident edge to undergo an event.
Introduction
Introduction
Random walks are a fundamental concept in probability theory, used to model processes that execute a sequence of random steps. When applied to graphs, they serve as a vehicle for the investigation of the propagation of motions or information over networks. In a random walk, an individual starts from some initial node and in every step goes to one of the nodes it is linked to randomly. Even though one cannot choose any single step, if one traces all steps it can provide some very interesting characteristics of the graph itself.
The project is intended to mimic classical random walks on several different sorts of graphs, including cycle graphs, grid graphs, directed graphs, and complete graphs. All these sorts of graphs contain different degrees of symmetry, connectivity, and constraints that make a difference in how likely it is to return to the starting point or be very far away. For instance, in a complete graph, every node is connected to each other node, allowing for a great deal of randomness, but in a cycle graph, movement is more constricted and symmetrical. Directed graphs, on the other hand, introduce direction, breaking symmetry and making some paths more likely than others.
By comparing the start and end probabilities of random walks across different graph networks this project aims to find out how graph structures induce the dynamics of stochastic processes.
Discrete Random Walk Statistics
Discrete Random Walk Statistics
In a discrete random walk, the walker moves from one vertex to an adjacent one, with the choice of the next vertex determined by randomly choosing an edge incident to the previous vertex, where the edge weights determine the probability of that edge being chosen. Given a graph, start vertex, number of steps in each walk, and number of walks to make, the functionality below returns each vertex’s proportion of being occupied during the discrete walk, as well as each vertex’s proportion of marking the end of a walk:
This function simulates multiple discrete-time random walks starting from a node, each with a fixed number of steps. It then computes the average number of visits and ending probability for each vertex, helping analyze the walk’s behavior on the graph.
In[]:=
graphDiscreteRandomWalkStatistics[graph_,startVertex_,stepCount_,sampleSize_]:=Module[{vertexList,neighborAssociation,visitedAssociations,endingVertices},vertexList=VertexList[graph];neighborAssociation=Replace[Transpose@DeleteCases[MapThread[List,{#,vertexList}],{0,_}],{{w_,v_}:>(w->v),{}->({}->{})}]&/@AssociationThread[vertexList->Normal@AdjacencyMatrix[graph]];{visitedAssociations,endingVertices}=Transpose@Table[graphDiscreteRandomWalkSample[vertexList,startVertex,stepCount,neighborAssociation],{i,sampleSize}];AssociationThread[{"VertexList","VisitationShare","EndingShare"}->Transpose[{#,N@Total[Through[visitedAssociations[#]]]/(stepCount*sampleSize),N@Lookup[Counts[endingVertices],#,0]/sampleSize}&/@vertexList]]]
This pair of functions runs a random walk moving one step at a time. At each step, it randomly picks a neighbor to move to, updates visit counts, and repeats until reaching the desired number of steps.
In[]:=
graphDiscreteRandomWalkSample[vertexList_,startVertex_,stepCount_,neighborAssociation_]:=Nest[makeDiscreteMove[neighborAssociation],{Append[AssociationMap[0&,vertexList],startVertex1],startVertex},stepCount]makeDiscreteMove[neighborAssociation_][{visitedAssociation_,currentVertex_}]:=With[{newVertex=RandomChoice[neighborAssociation[currentVertex]]},{Append[visitedAssociation,newVertexvisitedAssociation[newVertex]+1],newVertex}]
I will be creating a weighted cycle graph:
In[]:=
cg=CycleGraph[8,EdgeWeight->RandomReal[{0,1},8],VertexLabels->"Name",EdgeLabels->"EdgeWeight"]
Out[]=
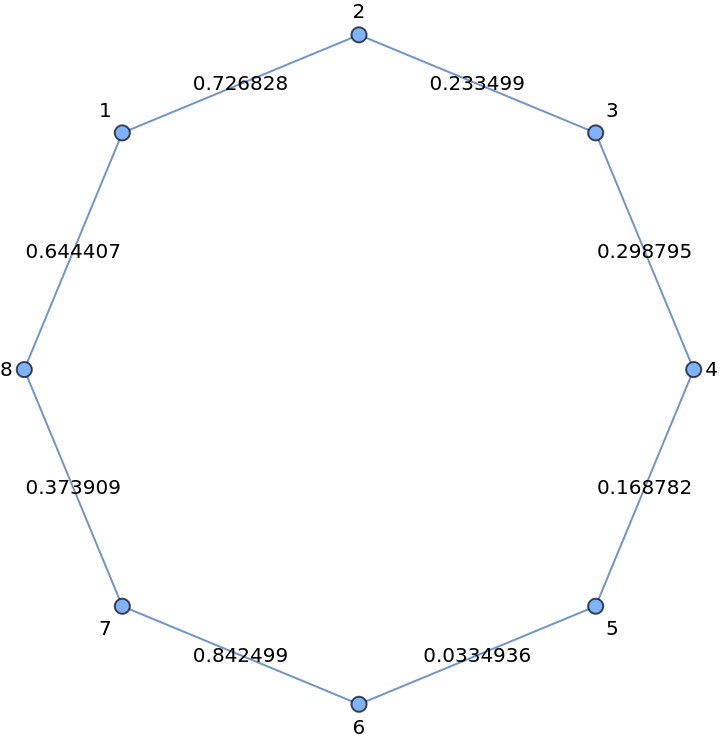
We investigated one thousand 100-step discrete random walks on it:
In[]:=
gdrws=graphDiscreteRandomWalkStatistics[cg,1,100,1000]
Out[]=
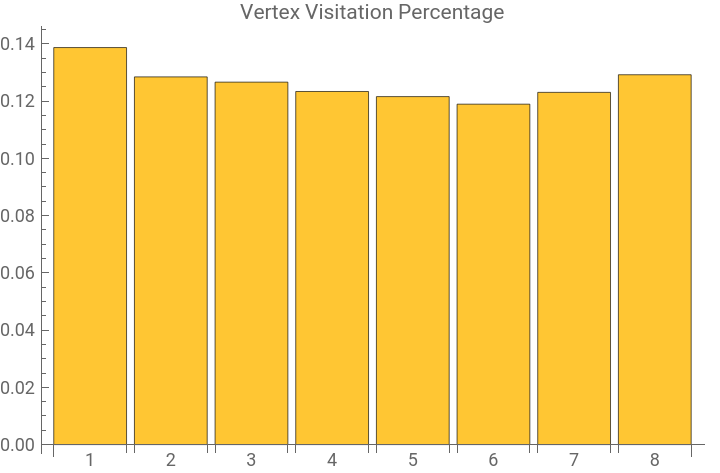
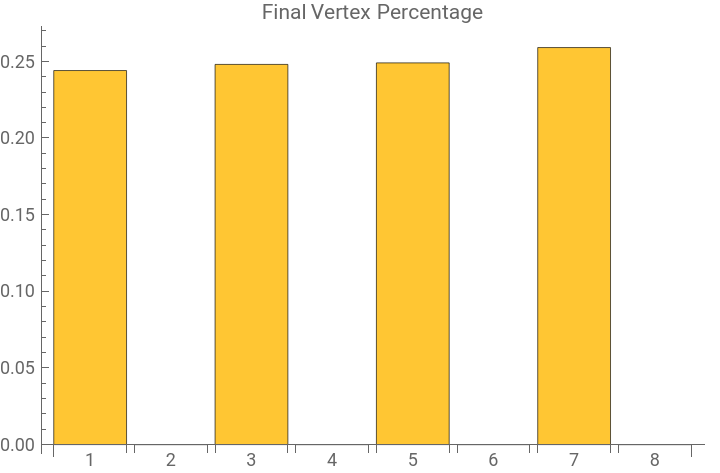
VertexList{1,2,3,4,5,6,7,8},VisitationShare{0.13872,0.12847,0.12664,0.12337,0.12158,0.11894,0.12306,0.12922},EndingShare{0.244,0.,0.248,0.,0.249,0.,0.259,0.}
The following code helps visualize the results:
In[]:=
graphRandomWalkBarChart[grws_,type:"VisitationShare"|"EndingShare"]:=BarChart[grws[type],ChartLabels->grws["VertexList"],PlotLabel->Switch[type,"VisitationShare","Vertex Visitation Percentage","EndingShare","Final Vertex Percentage"]]
Visualize data about how often vertices are visited:
In[]:=
graphRandomWalkBarChart[gdrws,"VisitationShare"]
Out[]=
Visualize data about how often vertices are at the end of the walk:
In[]:=
graphRandomWalkBarChart[gdrws,"EndingShare"]
Out[]=
Continuous Random Walk Statistics
Continuous Random Walk Statistics
In a continuous random walk, the walker moves from one vertex to an adjacent one, this time according to a Poisson process determined by edge weights, where if the walker occupies a given vertex at time t, they move along the next incident edge to undergo an event. Given a graph, start vertex, amount of time in each walk, and number of walks to make, the functionality below returns each vertex’s proportion of being occupied during the continuous walk, as well as each vertex’s proportion of marking the end of a walk:
This function runs many continuous-time random walks from a starting node, then calculates how much time is spent at each node (visitation share) and how often each node is the final stop (ending share). It helps analyze node importance and walk behavior on the graph.
In[]:=
graphContinuousRandomWalkStatistics[graph_,startVertex_,time_,sampleSize_]:=Module[{vertexList,adjMat,neighborAssociation,visitedAssociations,endingVertices},vertexList=VertexList[graph];adjMat=Normal@AdjacencyMatrix[graph];{visitedAssociations,endingVertices}=Transpose@Table[graphContinuousRandomWalkSample[vertexList,adjMat,startVertex,time],{i,sampleSize}];AssociationThread[{"VertexList","VisitationShare","EndingShare"}->Transpose[{#,N@Total[Through[visitedAssociations[#]]]/(time*sampleSize),N@Lookup[Counts[endingVertices],#,0]/sampleSize}&/@vertexList]]]
This function simulates one continuous-time random walk on a graph. It uses Poisson processes to generate random jump times along edges, moves the walker accordingly, and returns the time spent at each vertex and where the walk stopped. It’s used to gather data for statistical analysis over many such walks.
In[]:=
graphContinuousRandomWalkSample[vertexList_,adjMat_,startVertex_,time_]:=Module[{neighborAssociation},neighborAssociation=Association[MapThread[#1->Append[SortBy[Join@@Replace[DeleteCases[MapThread[List,{#2,vertexList}],{0,_}],{w_,v_}:>Thread[{Flatten@First@RandomPointConfiguration[PoissonPointProcess[w,1],Interval[{0,time}]],v}],{1}],First],{time,#1}]&,{vertexList,adjMat}]];NestWhile[makeContinuousMove[time],{AssociationMap[0&,vertexList],startVertex,0,neighborAssociation},#[[3]]<time&][[{1,2}]]]
These functions simulate continuous-time random walks on a graph. Each walk moves based on Poisson jump times, tracks time spent at each vertex, and records where it ends. Repeating this many times gives average visitation and ending probabilities for all nodes.
I created a weighted grid graph as an example for my results:
Here we collected data from one hundred samples of continuous random walks lasting 100 time units:
Visualize data about how often vertices are visited:
Visualize data about how often vertices are at the end of the walk:
More Explorations
More Explorations
Discrete
Discrete
Continuous
Continuous
Conclusion
Conclusion
In this project, we have simulated discrete and continuous random walks on various graph topologies to study how the structure of a graph can influence the probability of the positions during and at the end of a randomly walking particle. We have visualized four graphs: complete, grid, cycle and directed graphs. With custom-made functions, multiple random walk simulations were conducted to tally the visitation share and end share. These statistics, and their visual component in bar charts, help us examine and corroborate that certain vertices were elected on the dependence of the graph topology and the walk dynamics.
Future Directions
Future Directions
In the future, I would like to engage principles of quantum physics more deeply in my project by exploring the visualization of quantum walks. Specifically, I would like to simulate and analyze how the probability of a quantum particle starting and ending at a particular node varies with respect to the structure and topology of the graph it is walking on. By comparing different types of graphs such as cycles, grids, directed graphs, and complete graphs, I hope to observe patterns in quantum probability distributions that are unique. I also intend to compare my findings to theoretical models already established and determine if there are any previously discovered quantum algorithms that match or support the trends observed in my research. This comparison could provide additional understanding of quantum system behavior on graphs and possibly also reveal connections to realistic quantum computing approaches.
References
References
Acknowledgements
Acknowledgements
I would like to acknowledge my mentor Dan McDonald for guiding me through my project and for helping me with any difficulties I faced whilst looking through the paper. I would also like to thank Gloria Chan for her unwavering support and encouragement throughout the course of this project. Additionally I want to express my gratitude to Dr. Stephen Wolfram for designating and defining this project for me. Lastly, I would like to thank all of the program directors for their dedication throughout this summer school.
CITE THIS NOTEBOOK
CITE THIS NOTEBOOK
Analyzing random walk behavior on graph structures
by Madeline Burman
Wolfram Community, STAFF PICKS, July 10, 2025
https://community.wolfram.com/groups/-/m/t/3501660
by Madeline Burman
Wolfram Community, STAFF PICKS, July 10, 2025
https://community.wolfram.com/groups/-/m/t/3501660