Abstract
Abstract
In this project, I created a "game graph" for Tic-Tac-Toe, where each node represents a state of the board and each edge represents a possible move. I generated these graphs for several variations of the Tic-Tac-Toe game. The goal is to be able to visualize a variety of games and use the graphs to understand more about how the structure of Tic-Tac-Toe is affected by changes to the rules and board.
Creating the game
Creating the game
First, I needed to create the board. I represented a Tic-Tac-Toe board as three lists of three elements where each list represents a row. I used a 0 to represent an empty square, a 1 for the first player, and 2 for the second. Then, the elements in this list can be replaced to represent moves. Every possible configuration of the board can be described as this list of 0s, 1s, and 2s.
Representation of an empty 3x3 board as a "list of lists":
In[]:=
ClassicStartingBoard={{0,0,0},{0,0,0},{0,0,0}};
Here is a function that takes a list with the same format as above and generates a list of the possible moves that could be made from this position. It creates a new list where each new board has one 0 replaced with either a 1 or a 2 (depending on which player's turn it is).
In[]:=
GeneratingBoardsFunction[list_]:=ReplacePart[list,#->If[Count[Flatten@list,1]==Count[Flatten[list],2],1,2]]&/@Position[list,0]
Applying this function to our original empty board list:
In[]:=
Grid/@GeneratingBoardsFunction[ClassicStartingBoard]
Out[]=
,
,
,
,
,
,
,
,
1 | 0 | 0 |
0 | 0 | 0 |
0 | 0 | 0 |
0 | 1 | 0 |
0 | 0 | 0 |
0 | 0 | 0 |
0 | 0 | 1 |
0 | 0 | 0 |
0 | 0 | 0 |
0 | 0 | 0 |
1 | 0 | 0 |
0 | 0 | 0 |
0 | 0 | 0 |
0 | 1 | 0 |
0 | 0 | 0 |
0 | 0 | 0 |
0 | 0 | 1 |
0 | 0 | 0 |
0 | 0 | 0 |
0 | 0 | 0 |
1 | 0 | 0 |
0 | 0 | 0 |
0 | 0 | 0 |
0 | 1 | 0 |
0 | 0 | 0 |
0 | 0 | 0 |
0 | 0 | 1 |
Above is a list of nine different boards - the nine possible moves for the first player.
In[]:=
Removing symmetries
Removing symmetries
Because the graph was quite complicated, I removed moves that are symmetrical. For example, we do not need to consider a first player's move in the top-left corner as different than in the bottom-right corner, because they are equivalent. The following symmetries need to be removed:
◼
A horizontal reflection of the board
◼
A vertical reflection of the board
◼
A reflection across either diagonal
I needed to be able to express these three transformations computationally in order to remove them.
Here are the definitions of the functions and an example of each on the same random board. The first output is the original, the second is flipped vertically, the third horizontally, and the last diagonally.
In[]:=
BoardImage[{{1,0,0},{2,0,0},{0,1,0}}]FlipVertical[list_]:=Reverse[list]BoardImage[FlipVertical[{{1,0,0},{2,0,0},{0,1,0}}]]FlipHorizontal[list_]:=Reverse/@listBoardImage[FlipHorizontal[{{1,0,0},{2,0,0},{0,1,0}}]]FlipDiagonal[list_]:=Transpose[list]BoardImage[FlipDiagonal[{{1,0,0},{2,0,0},{0,1,0}}]]
Out[]=

Out[]=

Out[]=

Out[]=

Now, I was able to create a function that goes through a list of boards and finds the duplicates.
Function to find all symmetries:
In[]:=
FindSymmetricalCopies[bigList_,element_]:=Position[((element===FlipVertical[#]||element===FlipHorizontal[#]||element===FlipDiagonal[#]||element===FlipDiagonal[Reverse[#]])&&Position[bigList,#][[1]][[1]]>Position[bigList,element][[1]][[1]])&/@bigList,True]
Function to remove all of these symmetries from the list:
In[]:=
RemoveSymmetries[list_]:=Delete[list,List/@(Flatten[(FindSymmetricalCopies[list,#])&/@list])]
In the next line, I add this to the function which generates the next possible moves.
In[]:=
GeneratingBoardsFunction[list_]:=RemoveSymmetries[ReplacePart[list,#->If[Count[Flatten@list,1]==Count[Flatten[list],2],1,2]]&/@Position[list,0]]
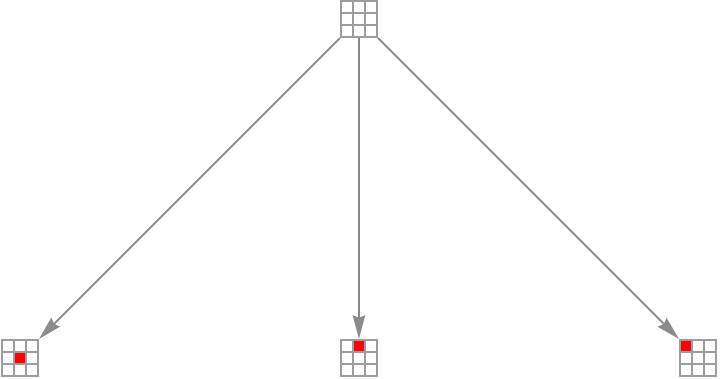
If we test this function again on the blank board, it should just show three options now: a move in the corner, a move on the edge, and a move in the center.
In[]:=
Grid/@GeneratingBoardsFunction[ClassicStartingBoard]
Out[]=
,
,
1 | 0 | 0 |
0 | 0 | 0 |
0 | 0 | 0 |
0 | 1 | 0 |
0 | 0 | 0 |
0 | 0 | 0 |
0 | 0 | 0 |
0 | 1 | 0 |
0 | 0 | 0 |
In[]:=
Checking for a "win"
Checking for a "win"
A player wins Tic-Tac-Toe by placing three numbers in a row, column, or diagonal, so I created a function that checks these three options and looks for whether either player has gotten three in a row. Then all the empty squares can be replaced with another number to prevent more moves.
Checking for a row, column, or diagonal of either 1s or 2s:
In[]:=
ThreeInRow[list_]:=If[ContainsAny[#==={1,1,1}||#==={2,2,2}&/@list,{True}]||ContainsAny[#==={1,1,1}||#==={2,2,2}&/@Transpose[list],{True}]||ContainsAny[#==={1,1,1}||#==={2,2,2}&/@{Diagonal[list],Diagonal[Reverse[list]]},{True}],#/.(0->9)&/@list,list]
Here is the updated GeneratingBoardsFunction to include this check for a winning player.
In[]:=
GeneratingBoardsFunction[list_]:=ThreeInRow/@RemoveSymmetries[ReplacePart[list,#->If[Count[Flatten@list,1]==Count[Flatten[list],2],1,2]]&/@Position[list,0]]
I also created functions that check which player has won.
In[]:=
P1Wins[list_]:=If[ContainsAny[#==={1,1,1}&/@list,{True}]||ContainsAny[#==={1,1,1}&/@Transpose[list],{True}]||ContainsAny[#==={1,1,1}&/@{Diagonal[list],Diagonal[Reverse[list]]},{True}],True,False]
In[]:=
P2Wins[list_]:=If[ContainsAny[#==={2,2,2}&/@list,{True}]||ContainsAny[#==={2,2,2}&/@Transpose[list],{True}]||ContainsAny[#==={2,2,2}&/@{Diagonal[list],Diagonal[Reverse[list]]},{True}],True,False]
Creating a graph
Creating a graph
After creating the basic elements of the game, I created a graph of the possible moves. It starts with the empty board and then draws edges to all the configurations of the board that can be reached in one move.
First, I used ArrayPlot to create an image of a board.
First, I used ArrayPlot to create an image of a board.
In[]:=
BoardImage[list_]:=ArrayPlot[list,ColorRules{0->White,1->Red,2->Blue},ImageSize20,Mesh->True]
Example with a random board:
In[]:=
BoardImage[{{0,1,0},{0,1,0},{2,0,0}}]
Out[]=

A graph can be created using MultiwaySystem from the function repository. This function allows us to specify the number of moves to show and the board we want to start from.
A graph of possible first moves:
In[]:=
GenerateBoards[]:=Function[list,GeneratingBoardsFunction[list]]ShowGraph[moves_Integer,board_List]:=ResourceFunction["MultiwaySystem"]<|"StateEvolutionFunction"GenerateBoards[],"StateEquivalenceFunction"SameQ,|>,{board},moves,"StatesGraph","StateRenderingFunction"(Inset[BoardImage[#2],#1]&)
First three moves:
In[]:=
ShowGraph[3,ClassicStartingBoard]
Out[]=
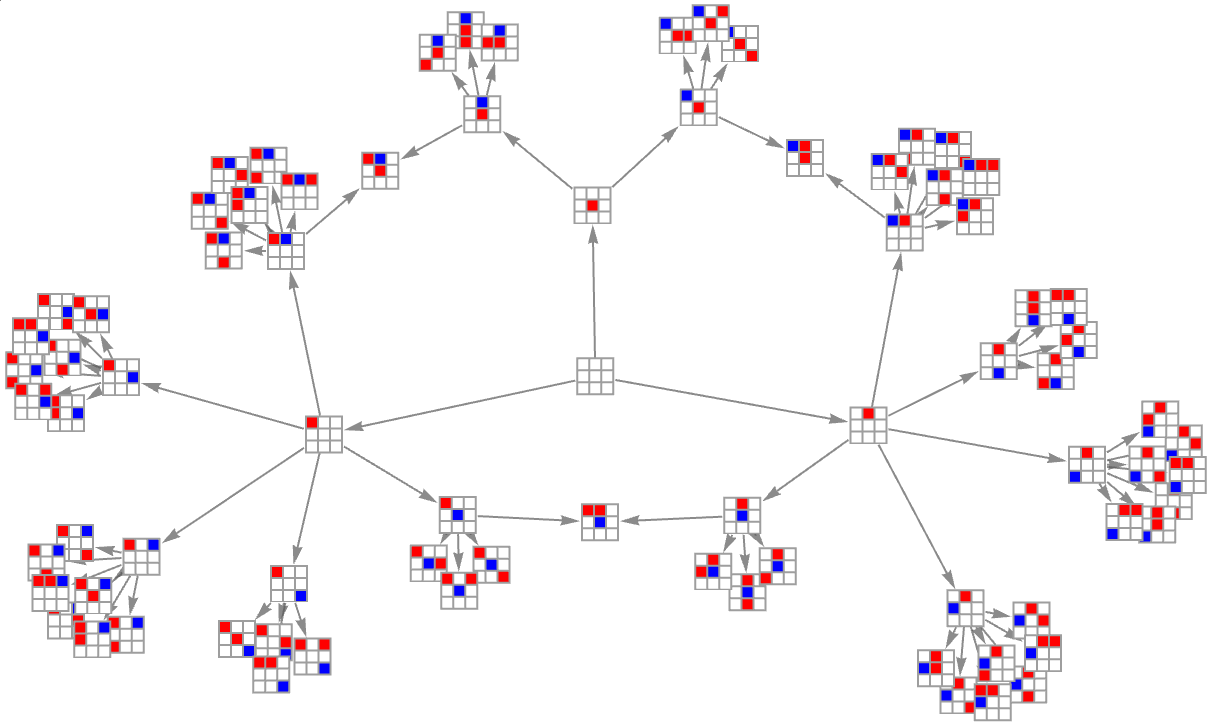
An animation of the first three moves:
In[]:=
ListAnimate[Table[ShowGraph[moves,ClassicStartingBoard],{moves,Range[3]}]]
Out[]=
Here is a graph of the entire game, using StatesGraphStructure to show just dots and not images of the boards. I also added the LayeredDigraphEmbedding to make the structure more clear. This lays out the graph by layers, so in this case, all of the board possibilities after each move will be in one horizontal line.
Game variants
Game variants
Now that we have a function to create a graph, I tested it out with different versions of Tic-Tac-Toe. By using the graphs, we may be able to understand the differences between the games and the structures the initial rules and board create.
In[]:=
Larger squares
Larger squares
Just by looking at the first few moves, we can see that the topological structure is actually very similar between the 4x4 and 3x3 graphs. For example, there are still only three options for the first move after removing the symmetrical options. While the VertexCount of the 4x4 graph is much larger, the graphs show us that the two games are actually fairly similar.
In[]:=
Different shapes
Different shapes
In addition to simply testing larger boards, I wanted to test different shapes as well. I started by removing the square in the center of the board.
New board with 9 representing hole in center:
Visualization of first two moves (black square represents missing spot):
Entire game graph for modified board:
This graph shows us that this version of the game is much simpler and harder to win. Because the density of the edges stays much more constant than for the normal board, we can see that there are less wins and less moments that drastically change the possible results. If we count the number of winning boards, we see that with the board missing the center square, 32% of the ending boards are a tie. As a comparison, only about 10% of the ending boards are a tie with a normal board.
This can be observed more easily with the BalloonEmbedding. The normal board has larger clusters with connections between them representing important decisions in the game, where the board with the missing center is slightly more spaced out.
Same structure function, but with BalloonEmbedding.
Balloon embedding of classic game
3-dimensional version to make the clusters toward the end of the game more clear:
Balloon embedding of board with center missing
3D version again:
In[]:=
Thue-Morse move sequence
Thue-Morse move sequence
In the normal Tic-Tac-Toe game, players alternate between placing their number on the board: 121212121... The Thue-Morse sequence is a sequence which attempts to correct for any advantage the first player might have. Instead, players will take turns in the following sequence: 122121122... Below is a function which, instead of alternating between a 1 and 2 as the number to replace the 0 with, will follow the Thue-Morse sequence for moves.
It can be seen in the graph below that the blue player now takes both moves 2 and 3.
A sample of the first few moves:
Since the goal of the Thue-Morse sequence is to make the game more fair, I tested the percentage of the winning boards won by the second player (with random play).
A test of the probability of the second player winning using the normal alternating move sequence:
Using the Thue-Morse sequence slightly increased the rate at which the second player won, but only by a small percentage. You can see the subtle differences in the side-by-side game graphs below.
Conclusion
Conclusion
◼
I was able to generate graphs for various different Tic-Tac-Toe-like games.
◼
The graphs convey useful information and do a good job of describing the entire possibility of game states.
◼
With more time, I would have liked to do more mathematical analysis of the graphs. For example, I think it would be useful to have more ways to quantify their topological complexity.
◼
These graphs have many applications beyond Tic-Tac-Toe. For example, the Wolfram Physics Project's graphs are similar to these, modeling all possible "game states" of the universe instead of a Tic-Tac-Toe board.
In[]:=
Keywords:
Keywords:
◼
Tic-Tac-Toe
◼
Graph
◼
Game