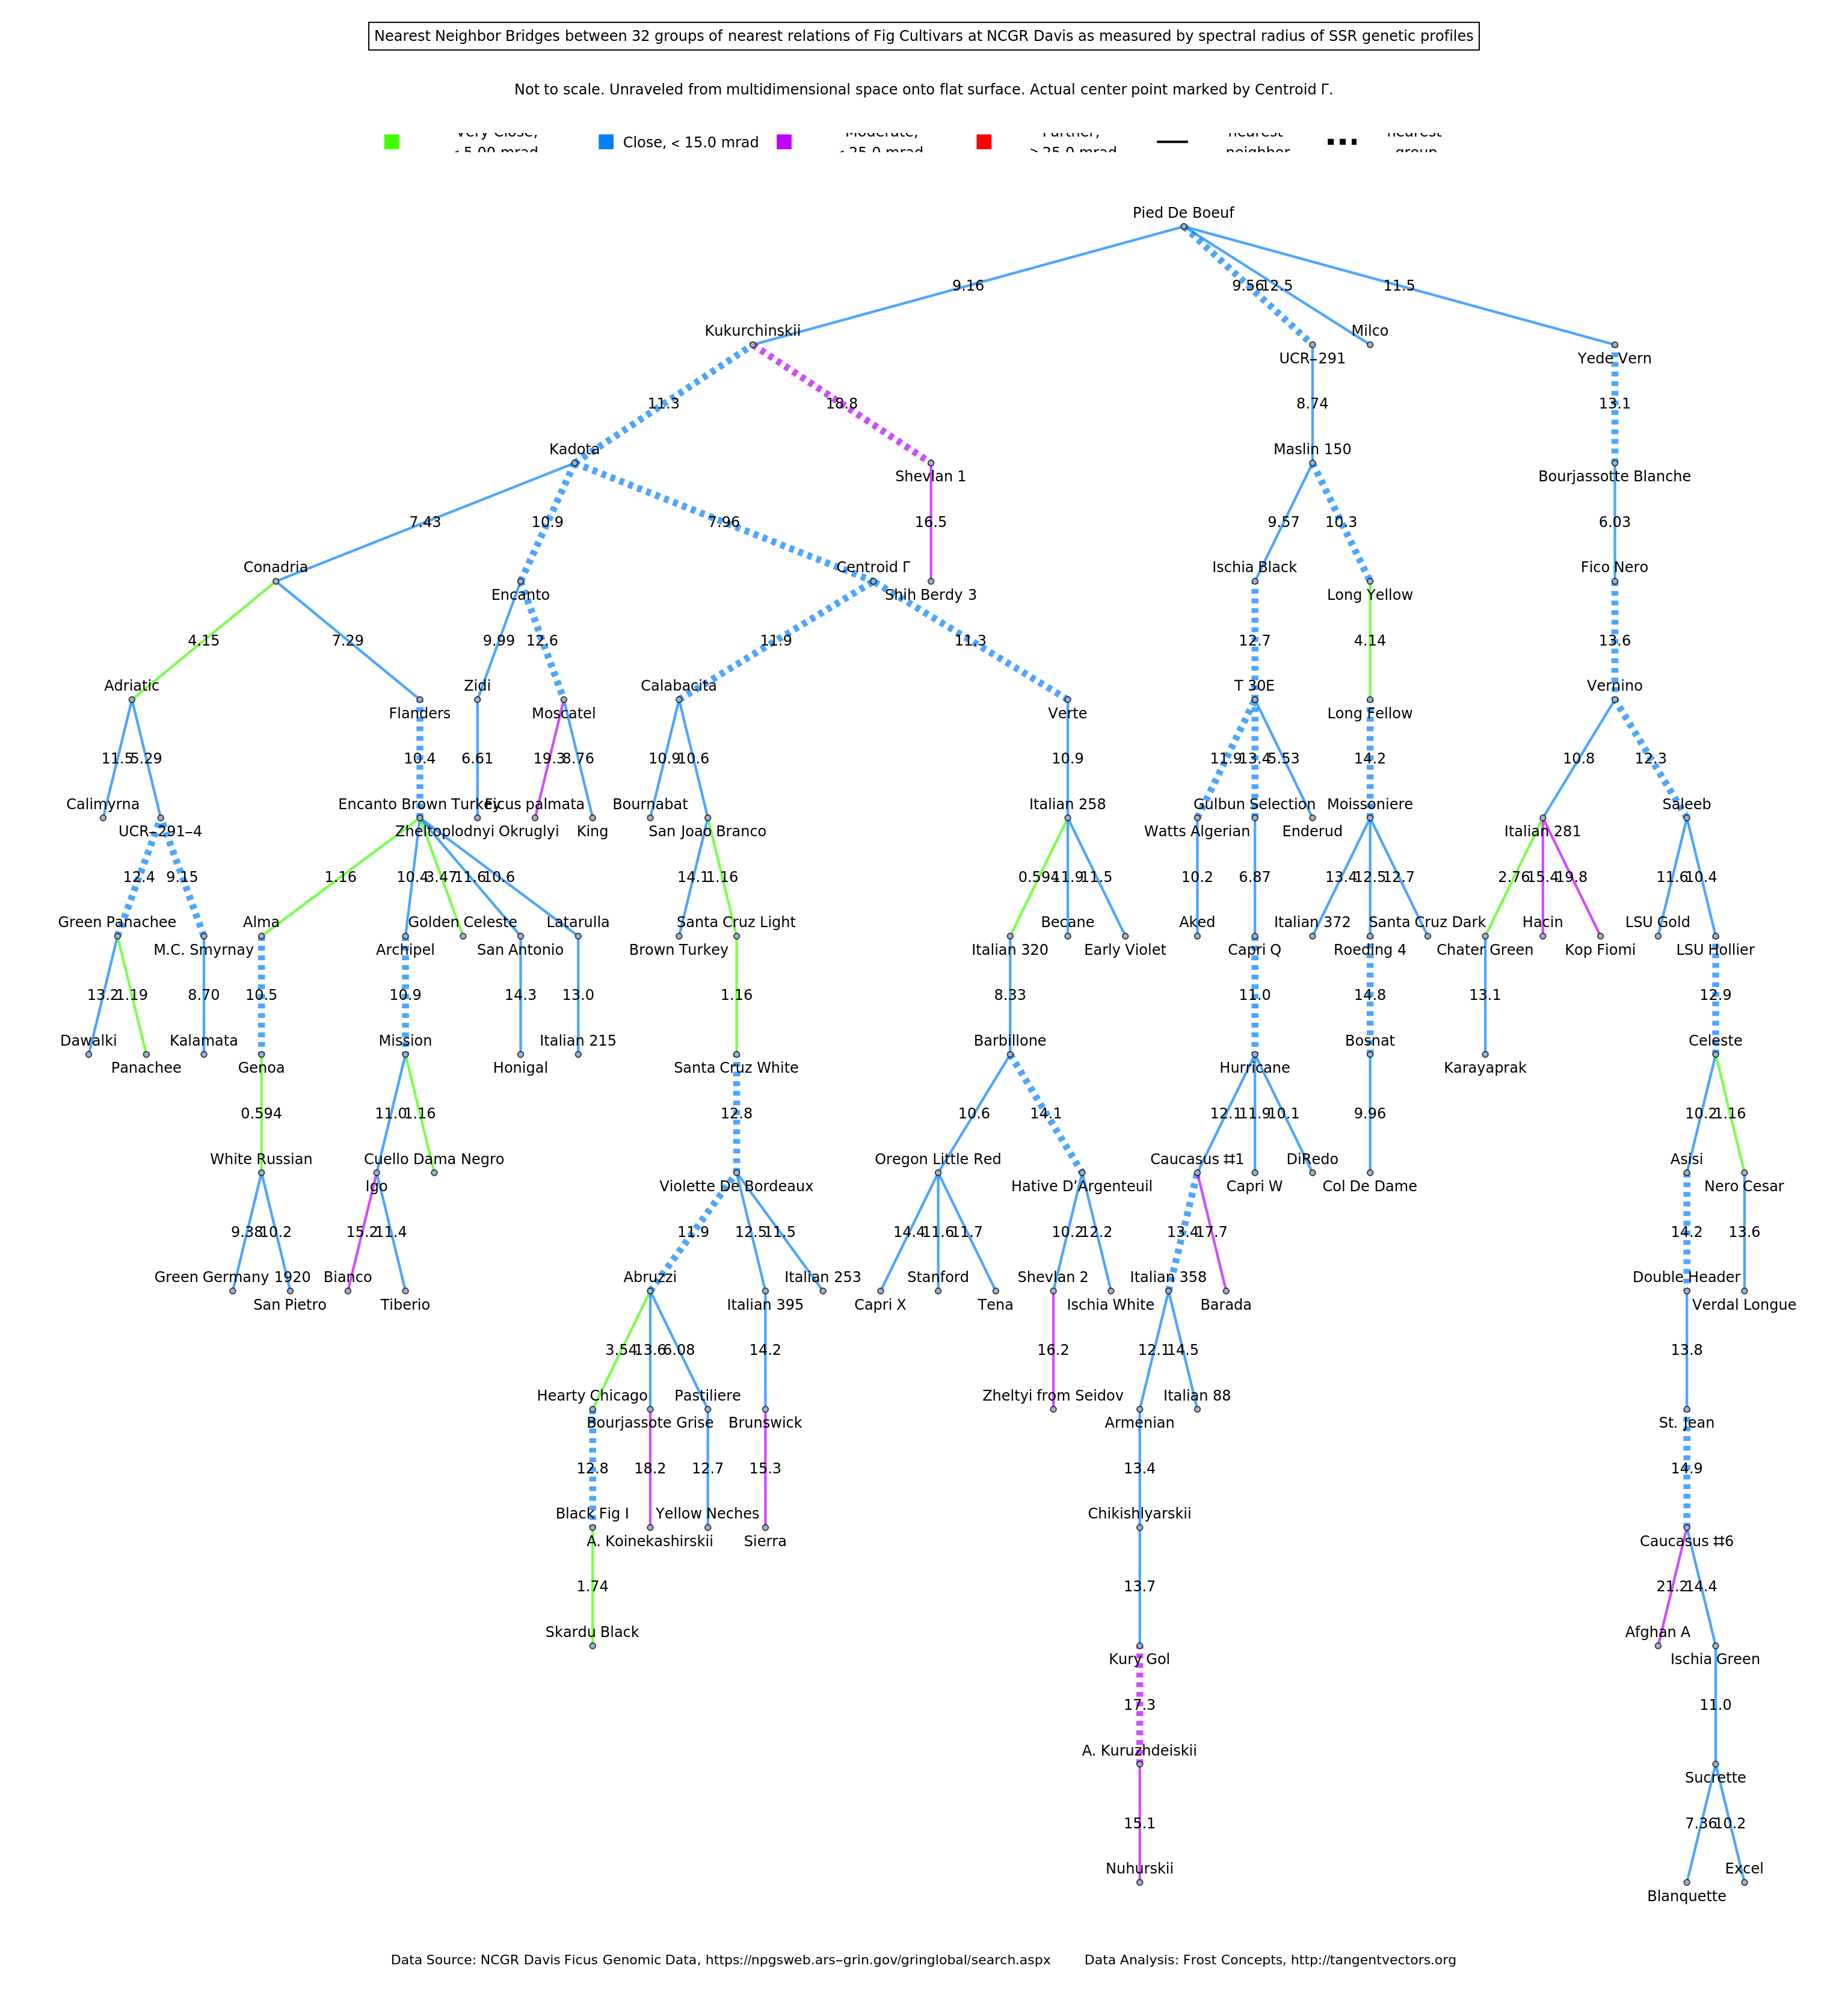
Example graphs of 125 edges, depicting nearest spectral radius distances between SSR profiles of selected fig cultivars.
Use at your own risk.
Use at your own risk.
In[]:=
NTEcsv=Import["http://figdb.org/NearestThetaEdges.csv"];
In[]:=
NTEheader=NTEcsv[[1]]
Out[]=
{V1,V2,EdgeLabel,EdgeLabelStyle,Dashing,Thickness,Hue}
In[]:=
SetPrecision[1.23856,3]
Out[]=
1.24
In[]:=
NearestThetaEdges=Annotation[#[[1]]#[[2]],{EdgeLabelsSetPrecision[#[[3]],3],EdgeStyle{Dashing[#[[5]]],Thickness[#[[6]]],Hue[#[[7]]]}}]&/@NTEcsv[[2;;]];
In[]:=
LEgPP=Graph[NearestThetaEdges,VertexSizeSmall,VertexLabelsPlaced[All,Automatic],VertexLabelStyle12,EdgeLabelStyleMedium,GraphLayout{"VertexLayout"->"LayeredEmbedding"},AspectRatio1,ImageSize1500];
In[]:=
vCoords=Thread[VertexList[LEgPP]GraphEmbedding[LEgPP]];
In[]:=
vByLayers=(SortBy[#,#[[2,1]]&]&/@GatherBy[Reverse[SortBy[vCoords,#[[2,2]]&]],#[[2,2]]&])[[All,All,1]];
In[]:=
vPlaces={Above,Below};
In[]:=
vLabels=Flatten[Table[#[[i]]Placed[#[[i]],vPlaces[[Mod[i,2,1]]]],{i,1,Length[#]}]&/@vByLayers,1];
In[]:=
LEg=Graph[NearestThetaEdges,VertexSizeSmall,VertexLabelsvLabels,VertexLabelStyle12,EdgeLabelStyleMedium,GraphLayout{"VertexLayout"->"LayeredEmbedding"},AspectRatio1,ImageSize1500];
In[]:=
clustertitle=;
In[]:=
subtitle=Style["Not to scale. Unraveled from multidimensional space onto flat surface. Actual center point marked by Centroid Γ.",Black,Medium];
In[]:=
clusterLegend=
;

In[]:=
credits=Style["Data Source: NCGR Davis Ficus Genomic Data, https://npgsweb.ars-grin.gov/gringlobal/search.aspx"<>" "<>"Data Analysis: Frost Concepts, http://tangentvectors.org",Black,11];
In[]:=
GraphicsColumn[{clustertitle,subtitle,clusterLegend,LEg,credits},ImageSize1536]
Out[]=