The Lorenz Map: Short-Term Predictability of Chaotic Systems
The Lorenz Map: Short-Term Predictability of Chaotic Systems


This Demonstration plots a map of the Lorenz system defined by
dx
dt
dy
dt
dz
dt
For various selections of the model parameters , , and , you can observe periodic behavior, period doubling, or chaotic behavior. For example, , , and shows chaotic behavior, while , , and gives periodic behavior.
σ
r
b
σ=16
r=45.92
b=4
σ=19.8
r=56
b=1
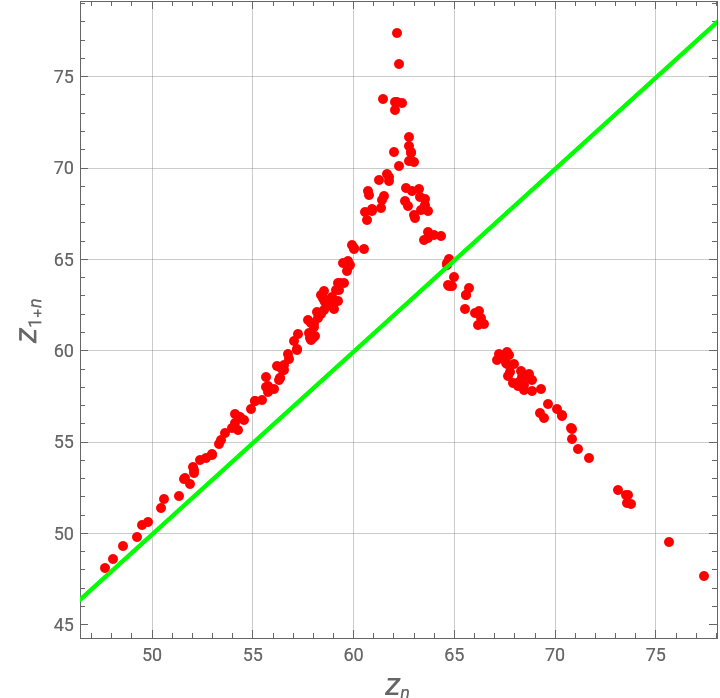
The maxima are readily found using the built-in Mathematica 9 function WhenEvent. Once the maxima are obtained, a relatively straightforward extension gives the Lorenz map, versus .
z
n
z
n+1
z
n
By plotting the reference line in green, it becomes clear that the absolute value of the slope of the Lorenz map is greater than 1.
y=x
The Lorenz map shows that there is a well-defined relation between successive peaks. Indeed, one can obtain a good estimate of the peak knowing the peak. Thus, one can conclude that the Lorenz system is predictable in the short term. In general, chaotic solutions are predictable in the short term but unpredictable in the long term.
th
(n+1)
th
n
References
References
[1] E. N. Lorenz, "Deterministic Nonperiodic Flow," Journal of Atmospheric Science, 20(2), 1963 pp. 130–141. doi: 10.1175/1520-0469(1963)020%3 C0130:DNF %3 E2 .0.CO;2.
Permanent Citation
Permanent Citation
Housam Binous, Ahmed Bellagi, Brian G. Higgins
"The Lorenz Map: Short-Term Predictability of Chaotic Systems"
http://demonstrations.wolfram.com/TheLorenzMapShortTermPredictabilityOfChaoticSystems/
Wolfram Demonstrations Project
Published: September 30, 2013