In a previous post I showed that there is more than one solution for one day(e.g. 14 March).
I therefore decided to check the following.
- how many solutions are there on average per day?
- how much difference is there between days with many solutions and days with few solutions?
- how many solutions are there on average per day?
- how much difference is there between days with many solutions and days with few solutions?
I explored all possible solutions using backtracking. I would greatly appreciate it if you could inform me of any alternative solutions you may have discovered, or if you possess a more efficient method for finding a solution.
Helper Functions
Helper Functions
Solutions for 14 March
Solutions for 14 March
There are 44 solutions for 14 March.
In[]:=
pieces={p1s,p2s,p3s,p4s,p5s,p6s,p7s,p8s};sol0314=allsolutions[3,14,pieces];
In[]:=
Length@sol0314
Out[]=
44
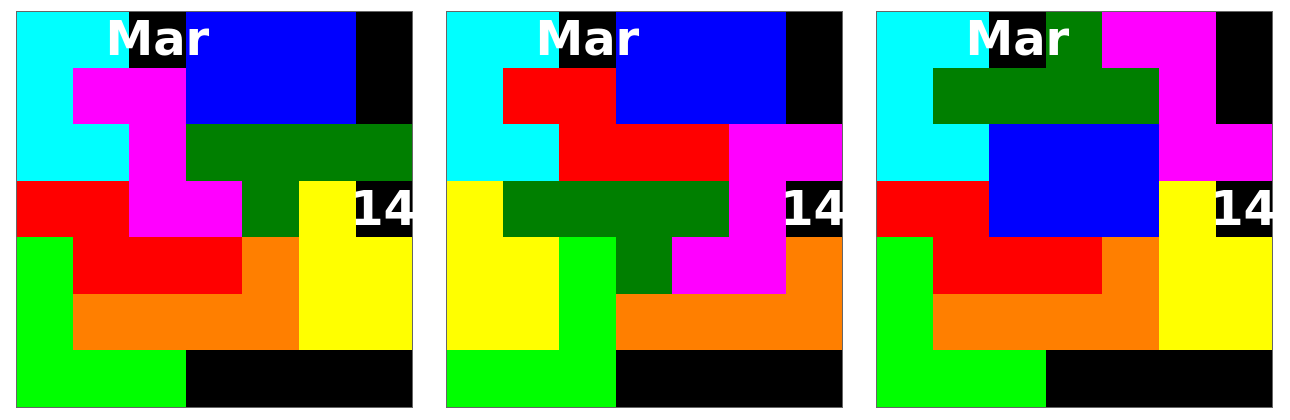
The first three of the solutions are as follows.
In[]:=
GraphicsRow[arrayplot[3,14,pieces,#]&/@sol0314[[;;3]]]
Out[]=
Solutions for 366 days
Solutions for 366 days
The 366-day solution is as follows
In[]:=
range=DateRange,,{1,"Day"};day366=Table[DateValue[i,{"Month","Day"}],{i,range}];pieces={p1s,p2s,p3s,p4s,p5s,p6s,p7s,p8s};(*Takesalongtime*)(*sols=ParallelMap[allsolutions[#[[1]],#[[2]],pieces]&,day366];*)
In[]:=
sols=;
In all, there are 24405 solutions. And the average number of solutions per day is approximately 67.
In[]:=
data=Transpose[{range,Length/@sols}];data[[All,2]]//Totaldata[[All,2]]//Mean//N
Out[]=
24405
Out[]=
66.6803
The day with the highest number of solutions is 25 January and the day with the lowest is 6 October, a difference of more than 30 times.
In[]:=
MaximalBy[data,#[[2]]&,3]MinimalBy[data,#[[2]]&,3]
Out[]=
,216,,195,,191
Out[]=
,7,,8,,12
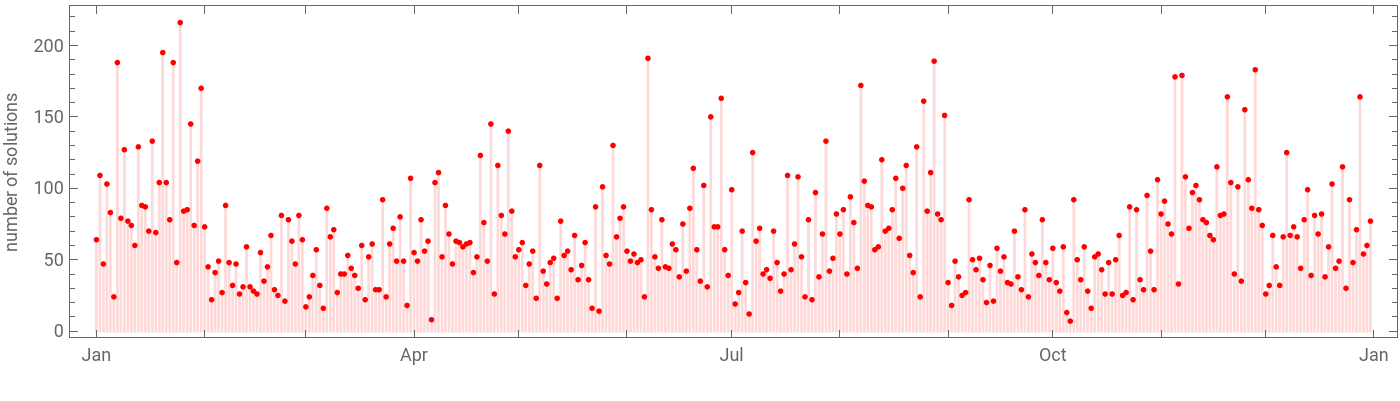
A visualisation of the year is as follows
In[]:=
DateListPlotdata,
Out[]=