Calculus connects: teaching IBDP aligned Calculus with Wolfram Demonstration
by Hasan Khan
International School, Tanzania
by Hasan Khan
International School, Tanzania
The International Baccalaureate Diploma Programme (IBDP) is a two-year educational programme primarily aimed at 16-to-19-year-olds in 144 countries around the globe. Calculus is one of the major topic in mathematics which is a compulsory subject for graduating students. This document provides an extensive list of highly interactive and revealing Wolfram demonstrations that can readily be utilized in teaching Calculus in the class .
Introduction
Introduction
High school math teachers are consistently put to the test when it comes to teaching Calculus. Traditional techniques and tools make it exceedingly difficult to instruct a clear picture of the various concepts in Calculus.The subject, however, can be made significantly more approachable, relevant and meaningful using Wolfram Demonstrations. The Wolfram Demonstrations Project is an open-source project that use dynamic computation to explain calculus principles. The purpose of this notebook is to list and provide a collection of the demonstrations that may be beneficial in International Baccalaureate Diploma Program (IBDP) Calculus course. The freely available CDF player can also be used to explore currently available demonstrations.
The notebook is divided into 5 sections. It begins with some resources that may be explored prior to beginning Calculus teaching, and it includes the idea of Tangent line from an algebraic standpoint, as well as Zeno’s paradox to motivate and encourage learners to reflect about the concepts of infinite and limitations. It also encompasses the investigation on exponential and rational functions. The second section addresses the concepts of limits and continuity. The concept of derivatives and their applications is thoroughly discussed in the third and fourth sections, while the fifth and sixth sections cover integration and its applications.
The notebook is divided into 5 sections. It begins with some resources that may be explored prior to beginning Calculus teaching, and it includes the idea of Tangent line from an algebraic standpoint, as well as Zeno’s paradox to motivate and encourage learners to reflect about the concepts of infinite and limitations. It also encompasses the investigation on exponential and rational functions. The second section addresses the concepts of limits and continuity. The concept of derivatives and their applications is thoroughly discussed in the third and fourth sections, while the fifth and sixth sections cover integration and its applications.
Getting Started
Getting Started
Find the tangent line to a parabola without using Calculus
Find the tangent line to a parabola without using Calculus
To begin, it is a good idea to apply pre-existing Algebra ideas to evaluate the equation of tangent on the parabola at a certain point. It is found by solving simultaneous linear and quadratic equations and setting the Discriminant to zero. This presentation gives the learner a thorough knowledge of how tangent lines behave.


Link: https://demonstrations.wolfram.com/FindingATangentLineToAParabola/
There is a neat method for finding tangent lines to a parabola that does not involve calculus. In this problem, for example, to find the line tangent to at (1, -2) we can simultaneously solve and and set the discriminant equal to zero, which means that we want only one solution to the system (i.e., we want only one point of intersection).
Contributed by: Jon Mormino (March 2011)
There is a neat method for finding tangent lines to a parabola that does not involve calculus. In this problem, for example, to find the line tangent to
y=-3
2
x
y=-3
2
x
y+2=m(x-1)
Contributed by: Jon Mormino (March 2011)
Zeno's Paradox
Zeno's Paradox
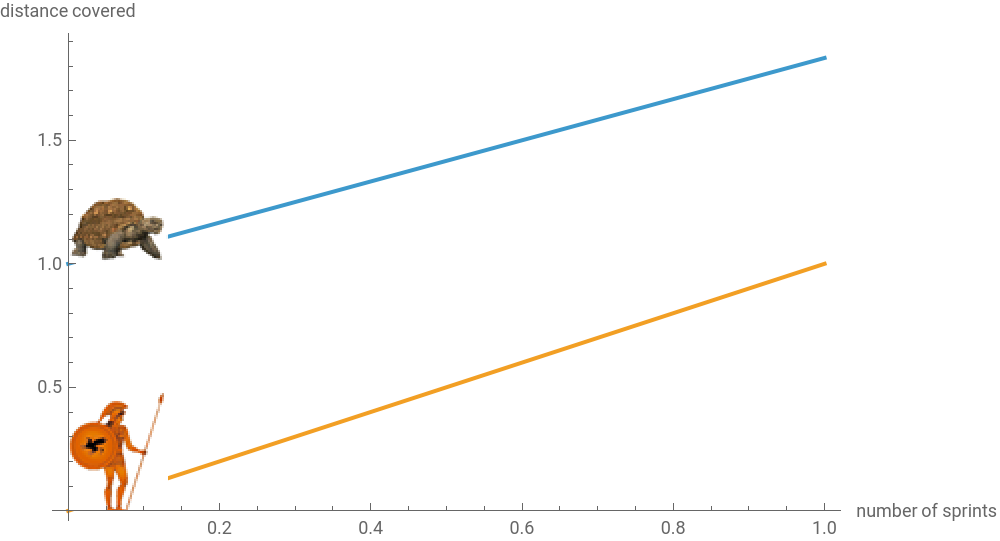
Link: https://demonstrations.wolfram.com/ZenosParadoxAchillesAndTheTortoise/
Zeno of Elea (circa 450 BC) is credited with creating several famous paradoxes, but by far the best known is the paradox of the tortoise and Achilles. A fleet-of-foot Achilles is unable to catch a plodding tortoise which has been given a head start, since during the time it takes Achilles to catch up to a given position, the tortoise has moved forward some distance. But this is obviously fallacious since Achilles will clearly pass the tortoise!
Contributed by: Jon McLoone (March 2011)
Exponential Decay
Exponential Decay
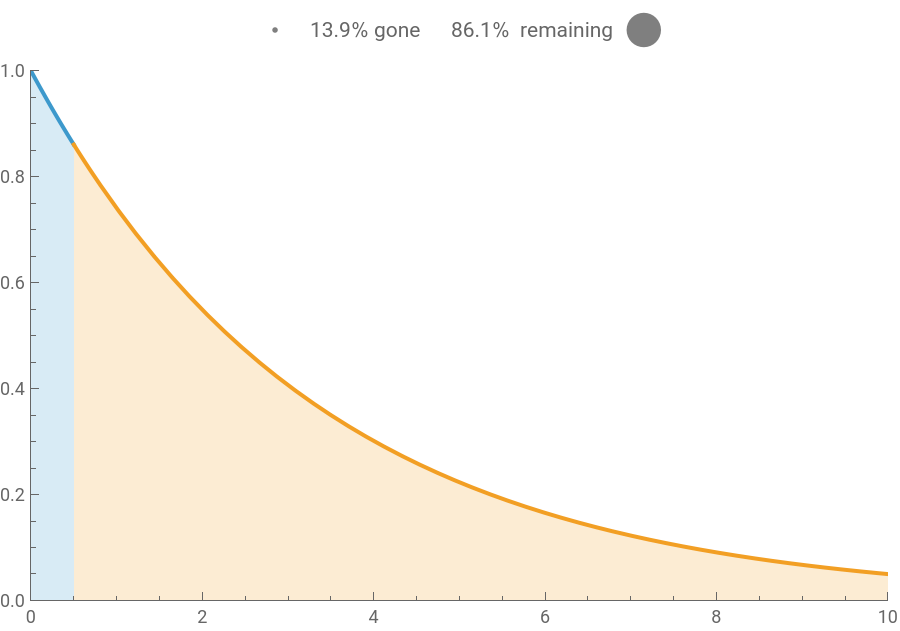
Link: https://demonstrations.wolfram.com/ExponentialDecay/
Explore how a quantity decreases when it undergoes exponential decay.
Contributed by: Stephen Wolfram (March 2011)
Explore how a quantity decreases when it undergoes exponential decay.
Contributed by: Stephen Wolfram (March 2011)
Continuous Exponential Growth
Continuous Exponential Growth
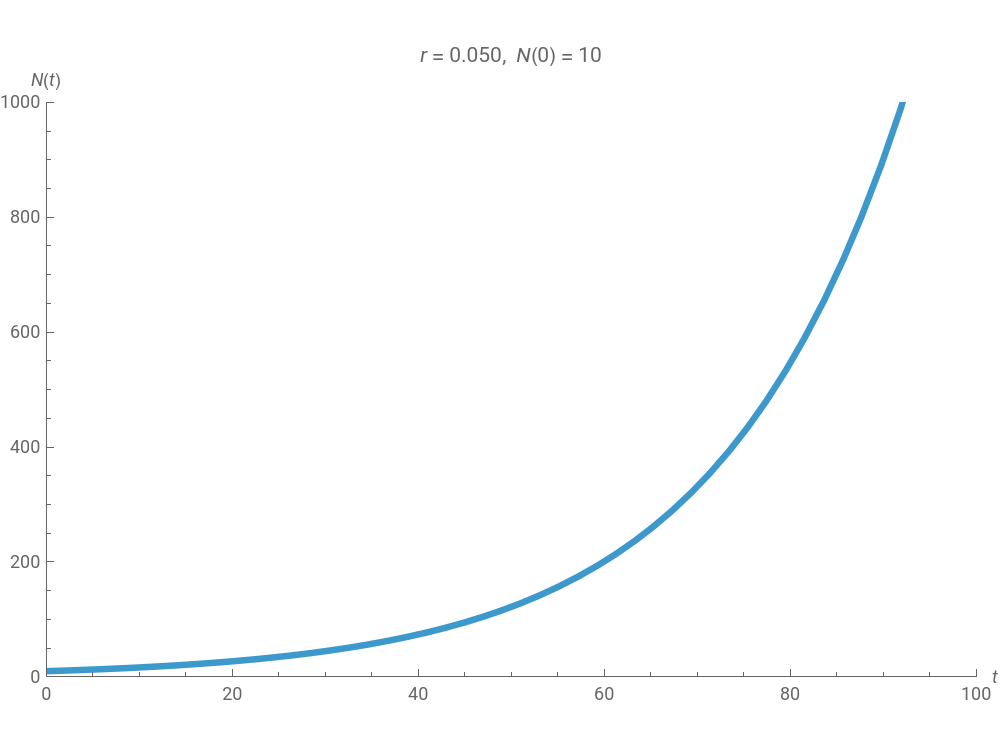
Link: https://demonstrations.wolfram.com/ContinuousExponentialGrowth/
Continuous exponential growth, where r is the growth rate, N(t) is the population size, and N(0) is the initial population size.
Contributed by: Gareth Russell (March 2011)
Continuous exponential growth, where r is the growth rate, N(t) is the population size, and N(0) is the initial population size.
Contributed by: Gareth Russell (March 2011)
Rational Function Graphs
Rational Function Graphs

Link: https://demonstrations.wolfram.com/RationalFunctionGraphs/
This Demonstration displays the graph of the rational function. Adjust the minimum and maximum values for and to best view interesting portions of the curve. Asymptotes and holes can also be displayed, and zoom provides a global perspective.
Contributed by: Charles E. Oelsner (Manlius Pebble Hill School) (March 2011)
This Demonstration displays the graph of the rational function
p(x)/q(x)
x
y
Contributed by: Charles E. Oelsner (Manlius Pebble Hill School) (March 2011)
The Concepts of Limits
The Concepts of Limits
Finite Limit at Infinity
Finite Limit at Infinity
Limit of a Family of Curves
Limit of a Family of Curves
Link: https://demonstrations.wolfram.com/LimitOfAFamilyOfCurves/
A semicircle of radius 1 and its diameter are approximated by two families of curves, which converge to the arc and the diameter in the limit. The areas between the jagged lines and the limits tend to 0 as grows. The sum of the lengths of the jagged lines of the first family tends to the length of the arc of the circle. But the sum of the lengths of the broken lines of the second family does not tend to the length of the diameter.
Contributed by: Bernard Vuilleumier (March 2011)
Squeeze Theorem
Squeeze Theorem
Limit Laws
Limit Laws
The Concepts of Derivative
The Concepts of Derivative
Secant and Tangent Lines
Secant and Tangent Lines
To understand the idea of slope of the tangent line, it’s vital to understand the concepts of secant and tangent lines: this demonstration illustrates the connection between the secant line and the tangent line at a point on the curve
Derivative as a function
Derivative as a function
Graphing the Derivative
Graphing the Derivative
After understanding the idea of secant and line ad tangent line, the student are tasked to find the derivative graphically:
Link: https://demonstrations.wolfram.com/GraphingDerivatives/
This Demonstration illustrates the connection between a function and its derivative on two separate graphs. The green vertical bars indicate the value of the rate of change at the point of tangency.
Contributed by: Joshua Fritz, Chad Pierson, and Angela Sharp (September 2007)
This Demonstration illustrates the connection between a function and its derivative on two separate graphs. The green vertical bars indicate the value of the rate of change at the point of tangency.
Contributed by: Joshua Fritz, Chad Pierson, and Angela Sharp (September 2007)
Differentiation Microscope
Differentiation Microscope
Instantaneous Rate of Change
Instantaneous Rate of Change
A Snowball’s Rate of Change
A Snowball’s Rate of Change
Tangent Lines to Exponential and Logarithmic Functions through the Origin
Tangent Lines to Exponential and Logarithmic Functions through the Origin
Tangent Lines to a Parabola
Tangent Lines to a Parabola
Link: https://demonstrations.wolfram.com/TangentLinesToAParabola/
Visualize the tangent lines to a parabola
Contributed by: Greg Radighieri (March 2011)
Visualize the tangent lines to a parabola
Contributed by: Greg Radighieri (March 2011)
The Product Rule
The Product Rule
The Quotient Rule
The Quotient Rule
Successive Derivatives of a Polynomial
Successive Derivatives of a Polynomial
Link: https://demonstrations.wolfram.com/SuccessiveDerivativesOfAPolynomial/
This shows the graphs of a cubic polynomial and its first, second, and third derivatives. Only the top slider affects the third derivative, and the bottom slider doesn’t affect the second derivative. Can you explain why?
Contributed by: Joe Bolte (March 2011)
This shows the graphs of a cubic polynomial and its first, second, and third derivatives. Only the top slider affects the third derivative, and the bottom slider doesn’t affect the second derivative. Can you explain why?
Contributed by: Joe Bolte (March 2011)
Application of Derivative
Application of Derivative
Shortest Time problem
Shortest Time problem
Link: https://demonstrations.wolfram.com/ShortestTimeProblem/
A dog fetches a ball thrown into a lake. Because the dog swims more slowly than it runs on sand, the shortest time path is not a straight line. You can drag the image of the dog to vary the path.
Contributed by: Oleksandr Pavlyk (March 2011)
A dog fetches a ball thrown into a lake. Because the dog swims more slowly than it runs on sand, the shortest time path is not a straight line. You can drag the image of the dog to vary the path.
Contributed by: Oleksandr Pavlyk (March 2011)
Keywords
Keywords
◼
Wolfram Demonstration
◼
CDF Player
◼
Limit
◼
Riemann
◼
IBDP
◼
Discriminant
◼
Rational Functions
◼
Riemann
◼
Zeno's Paradox
Acknowledgment
Acknowledgment
I’d want to offer my heartfelt appreciation to Craig Carter and AnneMarie Torresen for their unending encouragement and support.
References
References
References are given in-text.