The annelids (Annelida, from Latin anellus, “little ring”), also known as the ringed worms or segmented worms,, are a large phylum, with over 22,000 extant species including ragworms, earthworms, and leeches.
In this exploration we are going to focus on a specific species of marine annelid worm called Platynereis dumerilii known to have a circalunar rythm. That means it matures and spawns in sync with the moon.
It lives in the sea bed and has a lifespan of about seven months. Under the full moon, the sex cells in adult worms mature; then, exactly 14 days later under the new moon and four hours after sunset, they float to the surface and synchronously release eggs and sperm. After spawning, the worms die, and a new generation begins to grow in the seabed.
It lives in the sea bed and has a lifespan of about seven months. Under the full moon, the sex cells in adult worms mature; then, exactly 14 days later under the new moon and four hours after sunset, they float to the surface and synchronously release eggs and sperm. After spawning, the worms die, and a new generation begins to grow in the seabed.
In[]:=
Import@First@WikidataData,"Image"
Out[]=
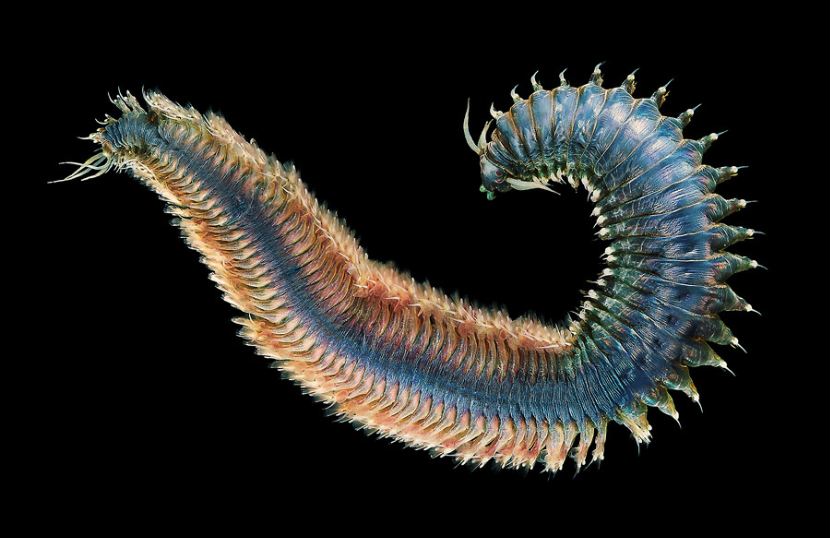
Since they float to the surface under the new moon in order to reproduce and they die afterwards, we might expect more human observations of these worms around new moon phases.
We can test the above hypothesis using GBIFSearch function (recently added to the Wolfram Function Repository) in order to obtain occurrences. And once we have the data we will use MoonPhase built-in function to know if there are more observations during new moon phases.
Let’s learn first a bit more about their taxonomy:
In[]:=
In[]:=
Out[]=
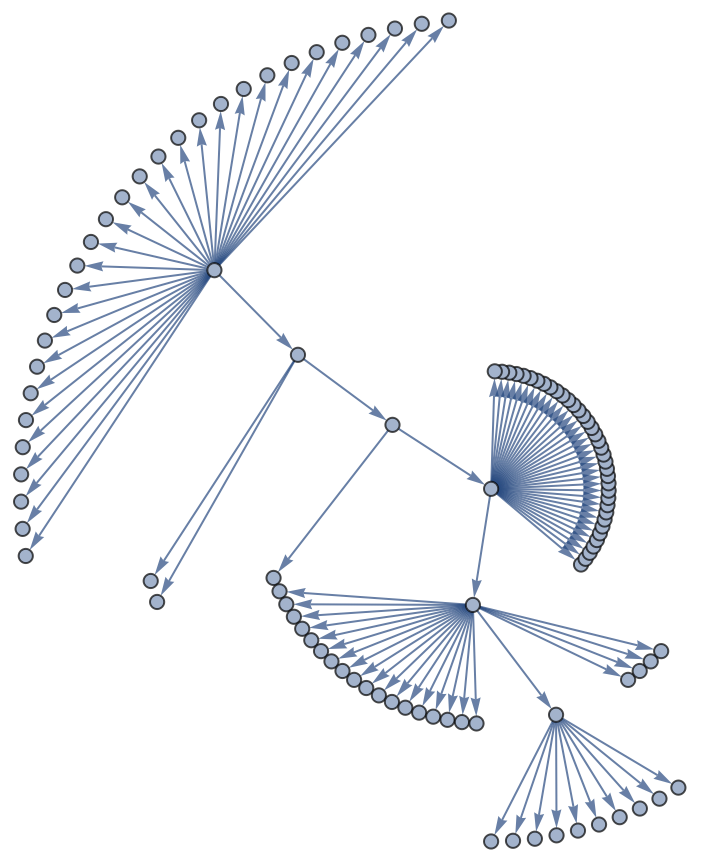
On the first argument of GBIFSearch we can specify the taxon name either as a string or as a species entity. We can also specify the “OccurrenceDateRange” to obtain the observations over the last few years:
In[]:=
ResourceFunction["GBIFSearch"]
Out[]=
In[]:=
annelidwormData=["Platynereis dumerilii","OccurrenceDateRange"{DateObject[{2016}],DateObject[{2020,08}]}]
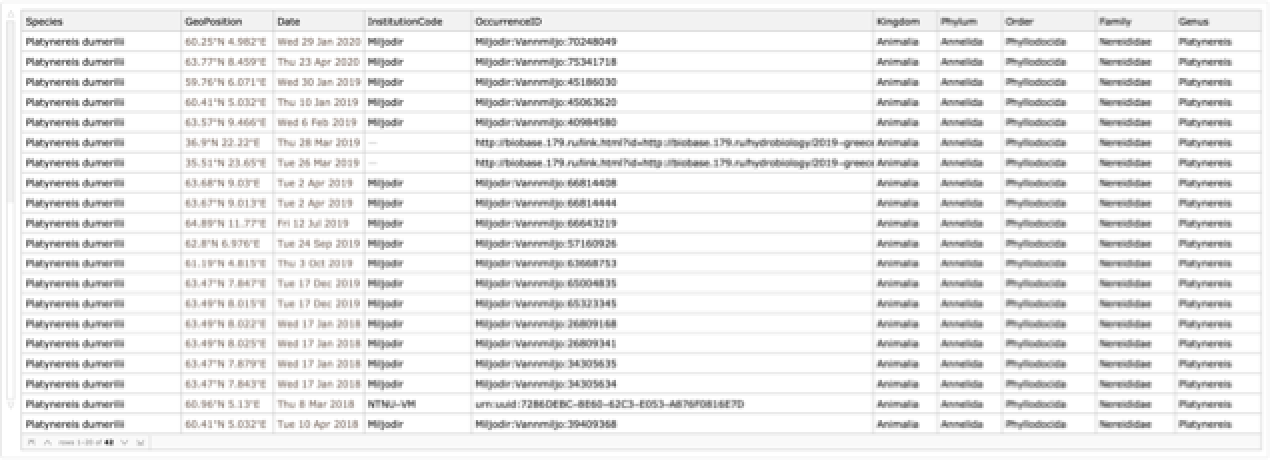
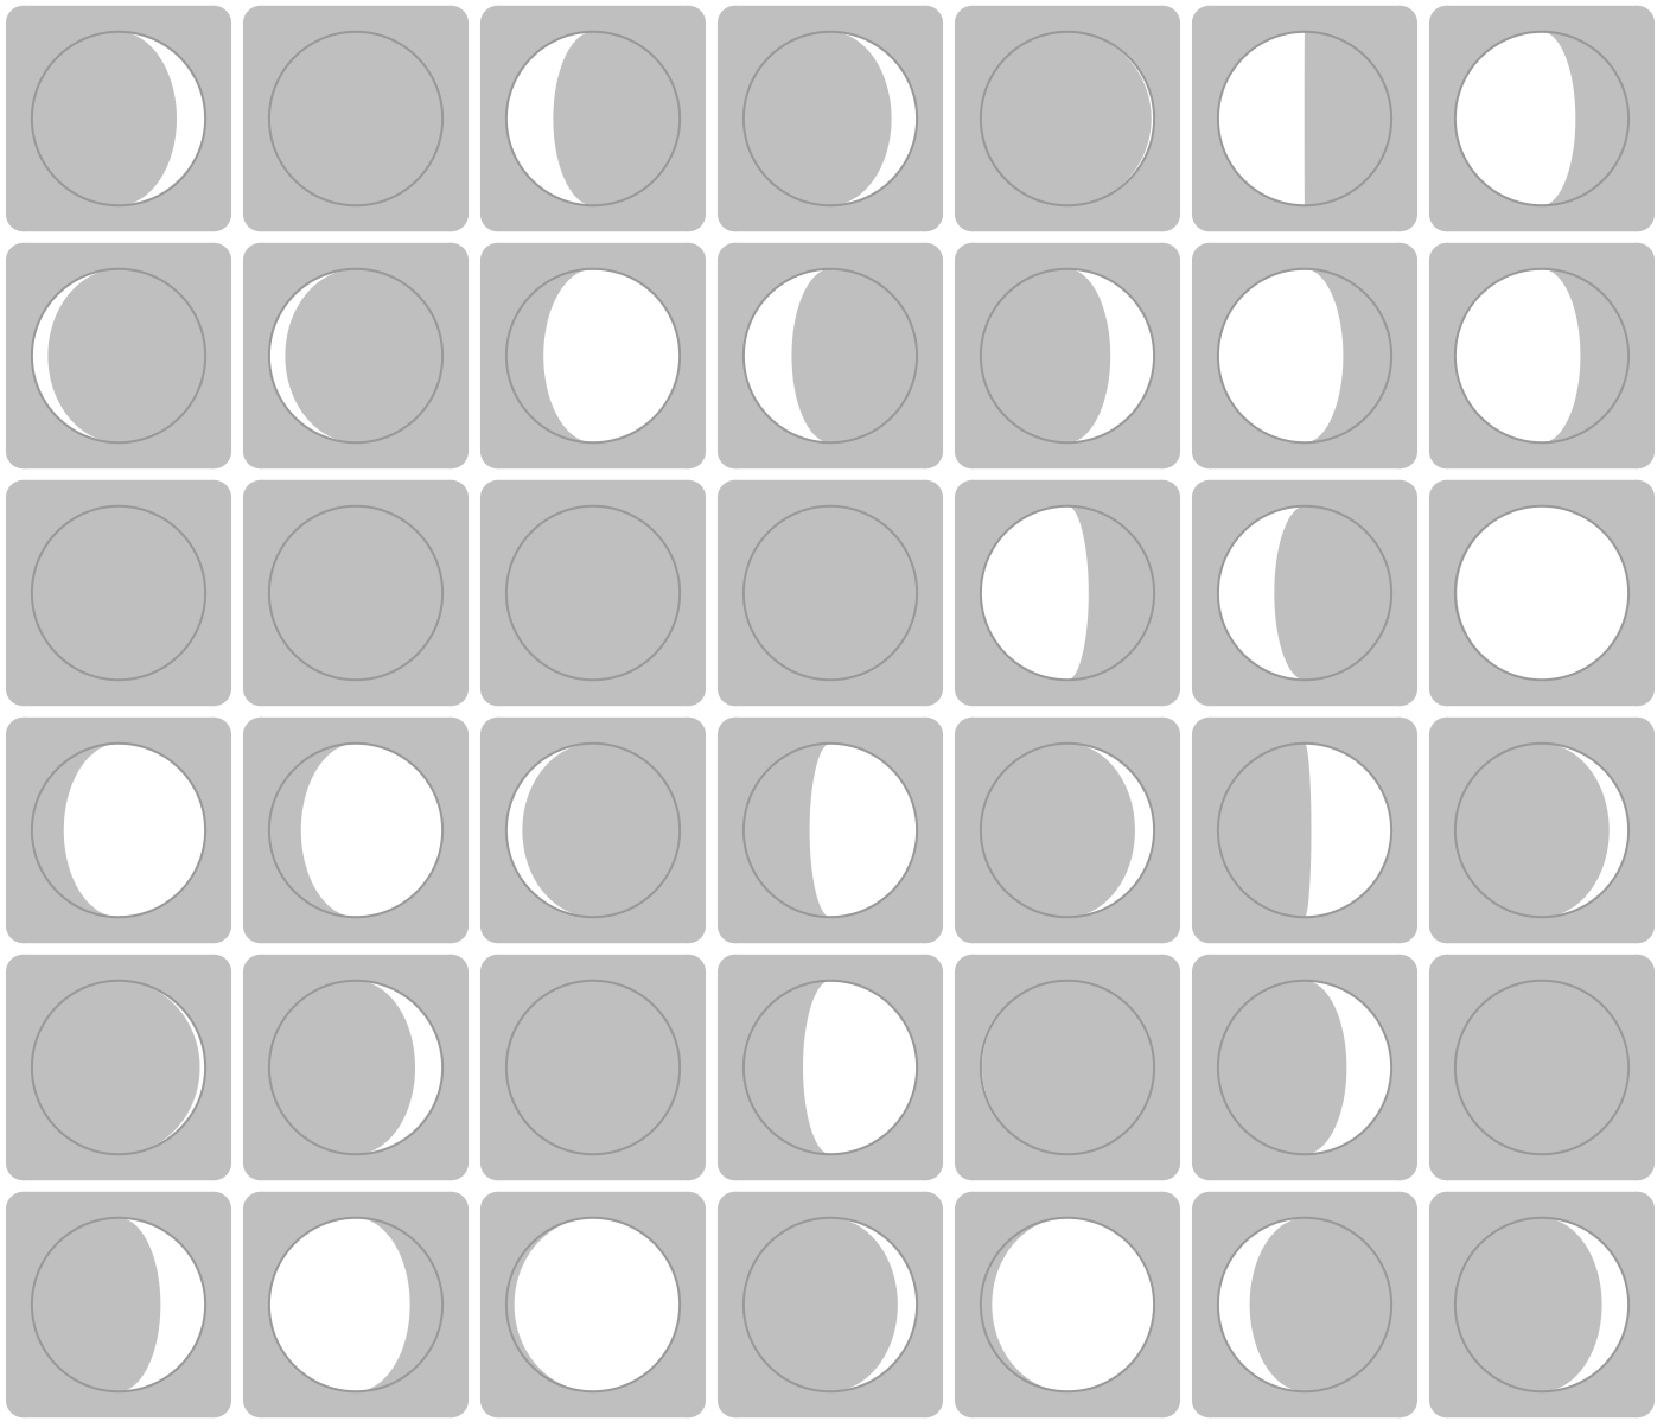
Now it’s straightforward to obtain the moon phase for each occurrence date. A convenient way to display them is via “Icon” (MoonPhase property) and ImageCollage:
In[]:=
ImageCollage@Map[MoonPhase[#,"Icon"]&,Normal@annelidwormData[All,"Date"]]
Out[]=
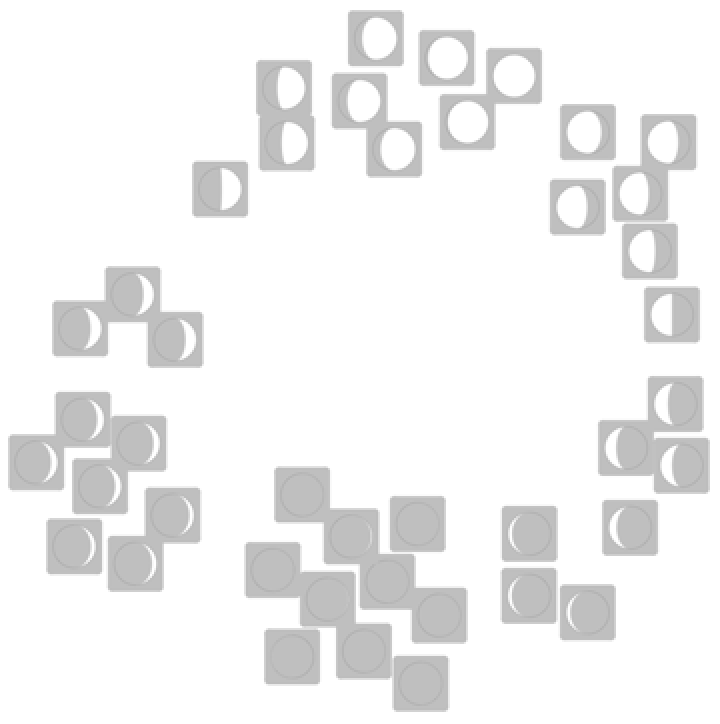
Alternatively, we can plot a FeatureSpacePlot to have a more visual representation of the different moon phases:
In[]:=
FeatureSpacePlot@Map[MoonPhase[#,"Icon"]&,Normal@annelidwormData[All,"Date"]]
In[]:=
moonPhases=Counts@Map[MoonPhase[#,"Name"]&,Normal@annelidwormData[All,"Date"]]
Out[]=
13,6,8,1,5,8,1
Clearly, most observations are around the new moon, specially in waxing crescent moon, which is the period that adult worms are destined to die while floating on the surface after their brief reproduction period during new moon.