Recurrence Plot of Mathematical Functions and Constants
Recurrence Plot of Mathematical Functions and Constants


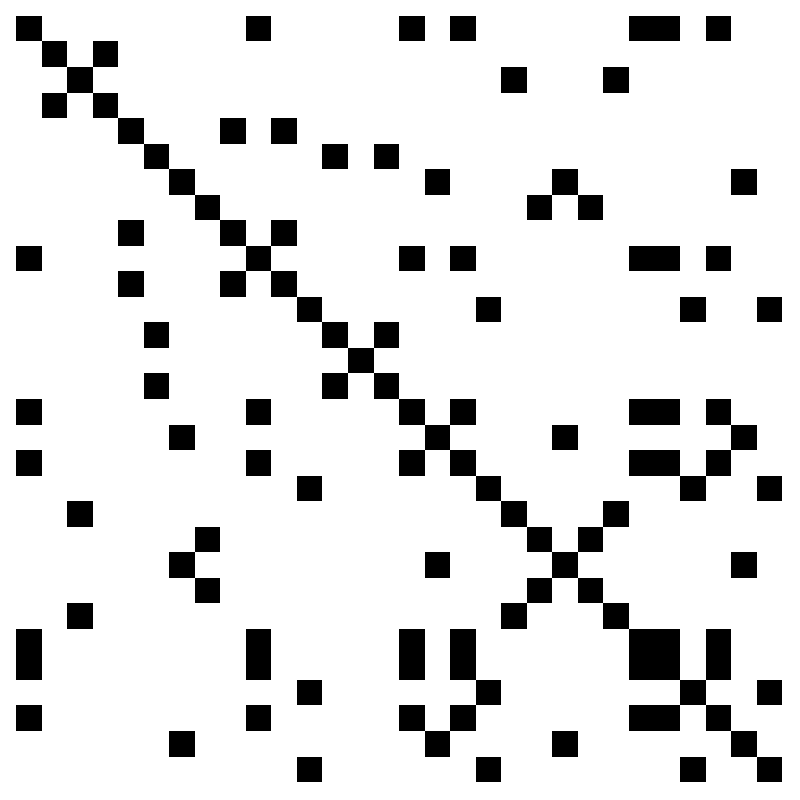
A recurrence plot illustrates the recurrence of states in a phase space where all the possible states of a system can be seen. Recurrence plots can be used to view and study mathematical functions such as sine and sinc or constants like , and so on. In the case of a function , the values used are the finite sequence , where is the size. In the case of a number, the values used are the digits of its decimal expansion taken to places.
π
e,
f
σ={f(-s/2),f(s/2+1),…,f(s/2-1),f(s/2)}
s
s
The expression plotted is , where is the Heaviside step function, is the sequence, and is a kind of tolerance.
R(x,y)=H(ϵ-σ(x)-σ(y))
H
σ
ϵ
The point view is a graphical representation of the matrix , which is binary because of the unit step function. In the density view, the points are grouped in clusters to give a smoother representation of the matrix, and the matrix rows are rotated (vertical shift).
R
R
The mesh draws lines that highlight the white spaces for the point view and gives reference rulers for the density view.
Details
Details
Reference: Recurrence Plots
External Links
External Links
Permanent Citation
Permanent Citation
Daniel de Souza Carvalho
"Recurrence Plot of Mathematical Functions and Constants"
http://demonstrations.wolfram.com/RecurrencePlotOfMathematicalFunctionsAndConstants/
Wolfram Demonstrations Project
Published: March 7, 2011