Random Values from Distributions
Random Values from Distributions


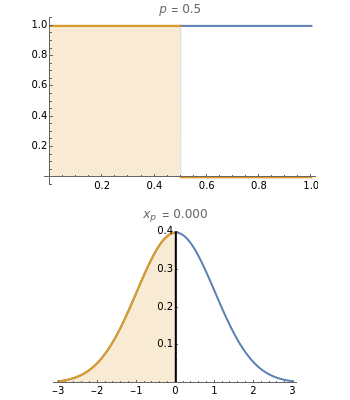
To observe values of a random variable that follows some arbitrary distribution, it is only necessary to be able to generate random numbers distributed uniformly in the unit interval and to compute quantiles of the desired distribution. (See the Demonstration "Using Rule 30 to Generate Pseudorandom Real Numbers" for a way to do the former.) The random number from the unit interval is simply used as the desired quantile of the more general distribution. That is, if is the density function for the distribution from which a random value is to be drawn and is a random number from the unit interval, the number is taken such that the area to the left of under is equal to . Thus, the pink area is equal to and the vertical line in the lower plot is at .
f(x)
p
x
p
x
p
f(x)
p
p
x
p