Startup and Steady State in a Chemostat
Startup and Steady State in a Chemostat


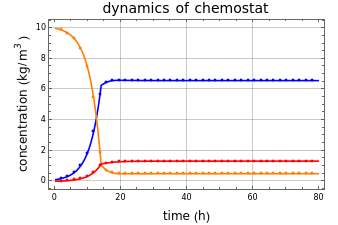
This Demonstration shows the operation of a chemostat. Starting up as a batch reactor, the concentrations change with time. After this short transient period, the bioreactor settles into a steady state.
The behavior of a chemostat, also called a continuous reactor, can be characterized by the concentration profiles of the reactants and products.
In this Demonstration, is time, is the concentration of a reactant consumed (also called the substrate), is the biomass (or cell) concentration, is the concentration of a product and is the dilution rate. The concentration in a perfectly mixed tank is uniform throughout the vessel and is therefore identical to the concentration of the effluent stream.
t
S
X
P
D
Details
Details
The characteristics of continuous operation are as follows:
Snapshot 1: steady state; after an initial startup period, there is no variation of concentrations with time
Snapshot 2: constant reaction rates, where is the biomass reaction rate, is the reaction rate of the consumed reactant and is the product reaction rate
r
X
r
S
r
P
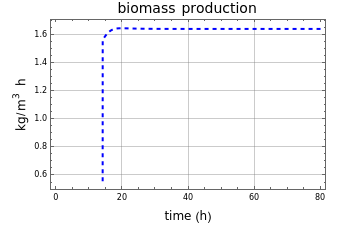
Snapshot 3: Washout of the organisms (cells) will occur when the dilution rate is greater than the specific growth rate . This corresponds to the complete removal of cells by flow out of the tank. In many references, including[1], the variables , , and productivity are plotted versus the dilution rate , which characterizes the steady state in a chemostat. See Related Links.
D
μ
X
S
P
DX
D
Some suggestions for the user:
Increase interactively to note effect on washout.
D
Change the feed substrate concentration to alter the steady state.
S
F
Investigate the influence of maintenance requirements on the steady-state biomass concentration.
Operate initially as a batch reactor with , and switch to chemostat operation with . is the maximum specific growth rate, and in this case was set up to .
D=0
D<
μ
max
μ
max
0.3
-1
h
Calculate , the biomass-substrate yield, making use of the yield graph.
Y
XS
References
References
[1] I. J. Dunn, E. Heinzle, J. Ingham and J. E. Přenosil, Biological Reaction Engineering: Dynamic Modelling Fundamentals with Simulation Examples, Second Edition, Weinheim, Germany: Wiley-VCH, 2003.
External Links
External Links
Permanent Citation
Permanent Citation
R. Ricardo Sánchez
"Startup and Steady State in a Chemostat"
http://demonstrations.wolfram.com/StartupAndSteadyStateInAChemostat/
Wolfram Demonstrations Project
Published: August 4, 2021