The Mid-Atlantic Ridge (MAR) is an underwater mountain range running down the center of the Atlantic Ocean, acting as a plate boundary between multiple tectonic plates. In this study, we accurately modeled the ridge-axis of the MAR using bathymetric and seismic data. Our final model achieved an Root Mean Squared Error (RMSE) = 35.7762 km and Mean Absolute Error (MAE) = 25.1223 km when tested against the aggregated bathymetric and seismic data. Using the modeled ridge-axis, we conducted a comprehensive statistical analysis of seismic activity trends with respect to earthquake magnitude, depth, and spatial distribution. We first verified that the magnitudes of Mid-Atlantic Ridge earthquakes followed the Gutenberg-Richter Law. Furthermore, we discovered the existence of a Gaussian-like distribution when plotting earthquake distance from the MAR to earthquake magnitude. Due to low-resolution depth data, we were unable to identify any trends with respect to earthquake focal depth. Lastly, we found that there existed no observable trends between time and earthquake distribution across the MAR. Through this study, we hope to better understand tectonic processes as well as seismic trends on our planet.
Introduction
Introduction
The Mid-Atlantic Ridge (MAR) is an underwater mountain range that stretches approximately 16,000 kilometers from the Arctic Ocean to the Southern Ocean, running down the center of the Atlantic Ocean. It marks the boundary of multiple tectonic plates, separating the North American Plate from the Eurasian and African Plates in the North Atlantic, and separating the South American Plate from the African Plate in the South Atlantic. Most of the MAR are examples of divergent, or constructive plate boundaries, where plates move opposite from one another and new oceanic crust is constantly formed. Some sections of the MAR are transform, or conservative plate boundaries, where plates slide against one another.
Geologic History
Geologic History
The separation of Pangaea, which began around 200 million years ago, led to rifting and the eventual formation of the Atlantic Ocean. As fragments of continents drifted apart, magma from the Earth’s mantle rose up, creating oceanic crust and establishing what is known as the Mid-Atlantic Ridge. Over millions of years, the continuous formation of oceanic crust has allowed for seafloor spreading, forming the Atlantic ocean as we know today.
Discovery
Discovery
The existence of a Mid-Atlantic Ridge (MAR) was first hypothesized by Matthew Fontaine Maury in 1853, based on observations made on the surroundings of the USS Dolphin. Yet, there existed no empirical evidence for its formation or existence. It was not until 1925 that the existence of the ridge was confirmed through sonar, and the 1950s that Marie Tharp, Bruce Heezen, and Maurice Ewing discovered the existence of seismic activity along the ridge, leading to the theory of seafloor spreading.
Significance
Significance
Hydrothermal vents along the MAR serve as habitats for millions of diverse species, who utilize the chemical resource provided by the vents as a means of energy-production, otherwise known as chemosynthesis. The study of the MAR not only helps us better understand tectonic processes (i.e. seafloor spreading, seismic activity, volcanic activity, etc.), but also helps us to understand the diverse ecosystems that inhabit the hydrothermal vent systems along the ridge.
In this study, we will first attempt to map out the MAR axis using bathymetric data. Then, we will verify the results of our findings with seismic data in the Mid-Atlantic Ridge. Finally, we will conduct a statistical analysis of MAR earthquake trends.
Bathymetric Data Retrieval and Processing
Bathymetric Data Retrieval and Processing
Since this study revolves around the Mid-Atlantic Ridge, we will need to retrieve regional data using Wolfram’s Knowledgebase. To accomplish this, we will first utilize GeoElevationData to first retrieve global elevation data for the world. Next, we will process the data to isolate the Mid-Atlantic Ridge.
Downloads GeoElevation data of the world, detailing the bathymetry and topography of the world at a spatial resolution of x or ~9 km x 9 km:
~
o
0.088
~
o
0.088
In[]:=
worldData=QuantityMagnitude[GeoElevationData["World",GeoProjection->Automatic,UnitSystem->"Metric",GeoZoomLevel->4,GeoServer->{Automatic,"MaxServedTileCount"->512}]];
Creates a “pre-cropped” Mercator Projection of worldData on a relief plot:
In[]:=
ReliefPlot[worldData,DataReversed->True]
Out[]=
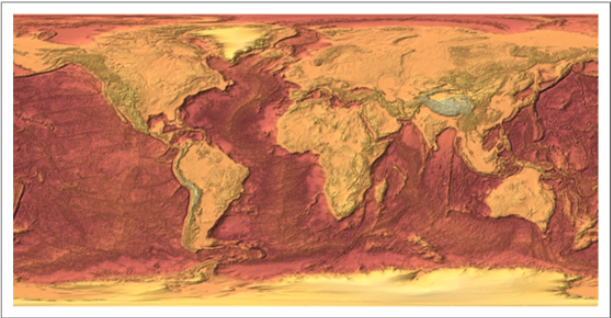
Isolates the Mid-Atlantic Ridge using Transpose and Drop; through latitudes N to S and longitudes of W to E:
o
72.42
o
59.24
o
92.11
o
30.59
In[]:=
worldLimited=Transpose[Drop[Drop[Transpose[Drop[Drop[worldData,200],-350]],1000],-1700]];
Plots the a “post-cropped” Mercator Projection of worldLimited on a relief plot:
In[]:=
ReliefPlot[worldLimited,DataReversed->True]
Out[]=
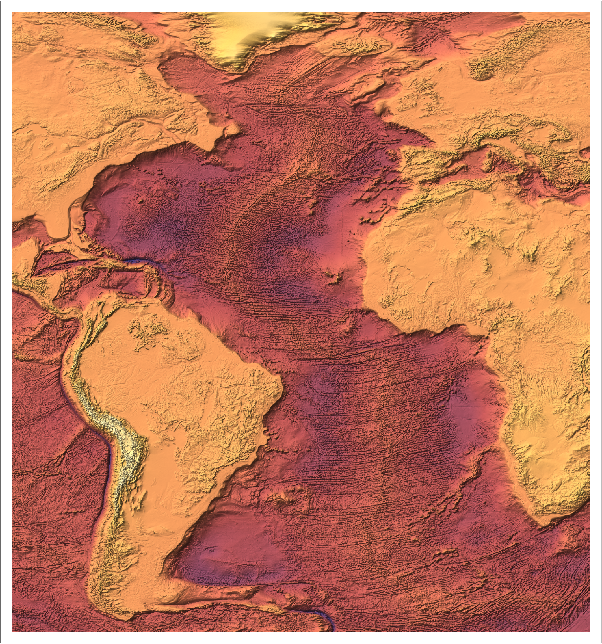
As seen in the relief plot above, there appears to be a line running down the Atlantic Ocean in certain regions of the graph. This line represents the Mid-Atlantic Ridge, which we will be attempting to map within the next section.
Latitudinal Mapping of the Mid-Atlantic Ridge via Bathymetry
Latitudinal Mapping of the Mid-Atlantic Ridge via Bathymetry
With the data now processed, we can use it to generate a rough sketch of the Mid-Atlantic Ridge. Since the Mid-Atlantic Ridge is an underwater mountain chain, the ridge lies at a higher elevation than its local surroundings. Thus, we must isolate the local bathymetric maxima within the Atlantic while avoiding other ridges such as the Terceira Rift at the Azores triple junction (Around ~1500 km West of Portugal). To do accomplish this, we will be iterating latitudinally to trace local bathymetric maxima, guaranteeing that data points at each successive latitude lie within an unit threshold from the prior.
x
Function Definitions
Function Definitions
First, we must define functions in order to help us map the Mid-Atlantic Ridge.
Isolates the section of a latitudinal row that contains longitudes within a dist unit threshold from the previous data point’s latitude to find the point of maximal elevation:
In[]:=
findMORPoint[row_List,prev_,dist_]:=Module[{l},l=Table[{row[[x]],x},{x,Max[prev-dist,0],Min[prev+dist,Length[row]]}];Reverse[Reverse[Sort[l]][[1]]]]
Iterates latitudinally to identify data points along the Mid-Atlantic Ridge:
In[]:=
lineCoordinates[bathymetry_,st_,en_,rev_,lstst_,dist_]:=Module[{lst,ret,temp,ivpair,i},(*lst=First@Ordering[bathymetry[[1]],-1];*)lst=lstst;ret=Table[lst=findMORPoint[bathymetry[[i]],lst,dist][[1]];{i,lst},{i,st,en,-1*Boole[rev]+Boole[Not[rev]]}];Return[ret]]
Mapping of Mid-Atlantic Ridge
Mapping of Mid-Atlantic Ridge
Using the functions defined above, we will now generate a rough sketch of the Mid-Atlantic Ridge. With a data point collected from Google Maps as the starting location, a list of latitudinally successive data points will be generated through the lineCoordinates function. After the generation of these data points, we will use a basis spline to fit the ridge-axis of the Mid-Atlantic Ridge. Points along the spline will then be plotted along a ReliefPlot to visualize the Mid-Atlantic Ridge axis.
Finds points along the Mid-Atlantic Ridge via the lineCoordinates function:
In[]:=
ridgeDataPoints=lineCoordinates[worldLimited,110,1375,False,761,12];
Now, we can select a number of data points to construct a spline function with a certain spline degree using ridgeDataPoints. In addition, we must choose the optimal number of data points and spline degrees that most accurately model the ridge-axis of the Mid-Atlantic Ridge.
Creates a manipulate for dataPointCount and splineDegree in order to determine optimal values that best models ridgeDataPoints:
In[]:=
Manipulate[Show[ListPlot[ridgeDataPoints,PlotStyle->{Red,Point[Small]},ImageSize->Large],ParametricPlot[BSplineFunction[Table[ridgeDataPoints[[i]],{i,1,Length[ridgeDataPoints],Quotient[Length[ridgeDataPoints],dataPointCount]}],SplineDegree->splineDegree][t],{t,0,1}]],{dataPointCount,2,Length[ridgeDataPoints],1},{splineDegree,1,5,1}]
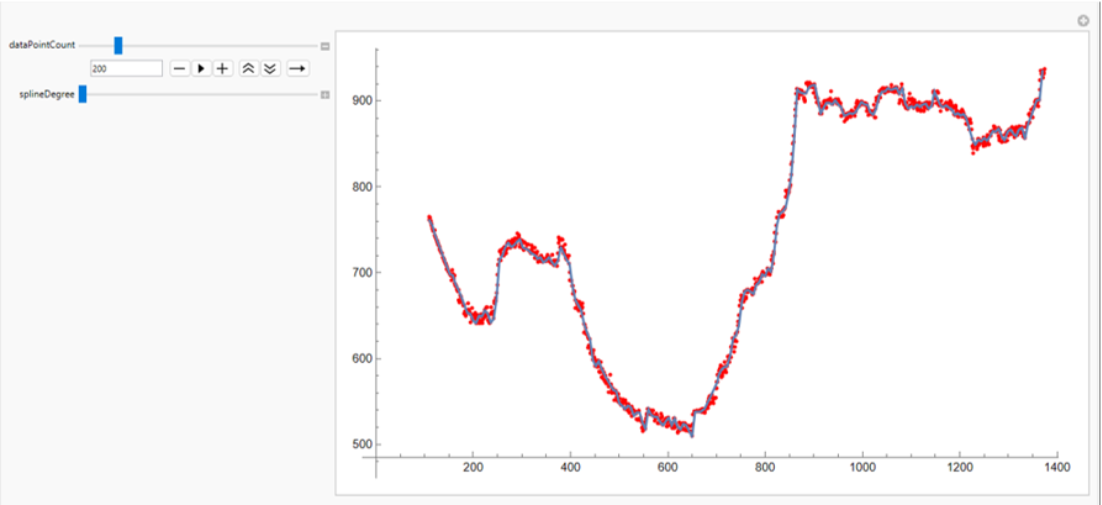
Since the Mid-Atlantic Ridge is jagged in nature, a splineDegree of 1 (linear) was determined to be optimal for modelling the ridge axis. Additionally, a dataPointCount of 150 seemed to sit at the perfect equilibrium between being too broad and too specific, creating a line with nature similar to that of the Mid-Atlantic Ridge.
Sketches Mid-Atlantic Ridge plotted along the ReliefPlot of worldLimited:
From superficial observations, it appears that the red line produced by the latitudinal bathymetric model seems to match up with the ridge-axis of the MAR. However, it is important that we validate this information, which we will do within our next section.
Mapping of the Mid-Atlantic Ridge via Bathymetric and Seismic Data
Mapping of the Mid-Atlantic Ridge via Bathymetric and Seismic Data
Within Earth’s mantle, there exists a process known as mantle convection, characterized by rising hot magma and sinking cool magma. As hot magma rises up, it moves to areas of lower pressure, which have lower melting points, leading to a process known as decompression melting. This magma is then erupted at the ridge when enough is built up, leading to seismic activity along these divergent boundaries. Along the transform boundary sections of the Mid-Atlantic Ridge, the shear along the boundary during movement produces shallow, seismic activity in the form of earthquakes.
Due to the ubiquitous seismic activity along the Mid-Atlantic Ridge, data of seismic activity over time can be used to map out the exact location of the divergent boundary. In this section, we will first validate the model produced by solely bathymetric data. Next, we will aggregate the bathymetric and seismic data to provide a more comprehensive dataset of points that lie on, or near the Mid-Atlantic Ridge. Lastly, we will use that dataset to produce a more accurate sketch of the Mid-Atlantic Ridge.
Due to the ubiquitous seismic activity along the Mid-Atlantic Ridge, data of seismic activity over time can be used to map out the exact location of the divergent boundary. In this section, we will first validate the model produced by solely bathymetric data. Next, we will aggregate the bathymetric and seismic data to provide a more comprehensive dataset of points that lie on, or near the Mid-Atlantic Ridge. Lastly, we will use that dataset to produce a more accurate sketch of the Mid-Atlantic Ridge.
Superficial Validation via Seismic Data
Superficial Validation via Seismic Data
First, we must retrieve seismic data from the Atlantic Ocean, again utilizing Wolfram’s Knowledgebase.
Defines a Polygon that isolates the Mid-Atlantic Ridge:
Downloads earthquake data from the past 23 years within the area of interest via the EarthquakeData function:
Creates a function to process the earthquake data, converting latitude and longitudinal coordinates to fit worldLimited:
Calls processFullEarthquakeData to fully process the retrieved data:
Displays earthquake data along a ReliefPlot of worldLimited:
As seen from the relief plot above, the sketch serves as a good approximation of the Mid-Atlantic Ridge at most regions. In certain regions, however, such as the Azores Triple Junction, the approximation is inaccurate. Our latitudinal-based approach was only accurate under the assumption that the Mid-Atlantic Ridge had only one data point per latitude index. In reality, this assumption was incorrect, leading to flaws in the sketch. In the next subsection, we will attempt to mitigate these errors by aggregating seismic data and bathymetric data to model the Mid-Atlantic Ridge using a more comprehensive dataset.
Data Cleaning
Data Cleaning
Now, let’s prepare our seismic data for aggregation with the bathymetric data. To accomplish this, we’ll delete “anomalies,” or data points that stray away from the Mid-Atlantic Ridge.
Removes anomalies by chunk, with a chunk size of 50 and chunk overlap of 25:
Compiles latitudes and longitudes from seismic data, and removes anomalies by calling the deleteAnomaliesByChunk function:
Removes extraneous data points lying along the triple junctions or at high latitudes:
Displays the seismic data, post-cleaning:
Modeling via Aggregated Bathymetric and Seismic Data
Modeling via Aggregated Bathymetric and Seismic Data
With the data now processed and cleaned, let’s build a new, more accurate model of the Mid-Atlantic Ridge. First, we will aggregate our bathymetric and seismic data and process it before model generation. Then, we will apply similar methodologies from our solely bathymetric-based model (i.e. Splines) to generate our new model.
Reflects isolatedMARPoints to match the rotation of bathymetric data:
Aggregates seismic data with selected function-like regions of bathymetric data:
Removes anomalies from the aggregated dataset:
Sorts specific sections latitudinally or longitudinally depending on the angle at which the ridge-axis is traveling:
Creates a manipulate for dataPointCount and splineDegree in order to determine optimal values that best models ridgeDataPoints:
Again, a splineDegree of 1 (linear) was determined to be optimal for modelling the ridge axis and a dataPointCount of 150 seemed to create the best fit-spline.
Rotates aggregated to prepare for plotting on a relief plot:
Displays the modeled ridge-axis on a relief plot:
From a superficial point of view, it appears that the line models the Mid-Atlantic Ridge relatively accurately. In the next section, we will delve into a statistical validation of the model.
Statistical Validation of Model
Statistical Validation of Model
Creates a BSplineFunction of the model:
Creates a function that returns the minimum distance from a point to model (i.e. the residuals):
Calls minimumDistancesToFunction for all earthquakes lying along the Mid-Atlantic Ridge to gather a list of residuals:
Calculates the RMSE of the model using residual data:
Calculates the MAE of the model using residual data:
Comprehensive Statistical Analysis of Mid-Atlantic Ridge Earthquakes
Comprehensive Statistical Analysis of Mid-Atlantic Ridge Earthquakes
With a line now drawn, we can now conduct further statistical analysis on earthquake magnitude and spatial distribution. As described earlier, it is well understood that earthquakes along the Mid-Atlantic Ridge occur due to the movements of plates and the uprising of magma. However, little to no statistical analysis has been conducted on the relationships between these various features of earthquakes. In this section, we will explore some of the potential relationships between various Mid-Atlantic Ridge earthquake features.
First, let’s retrieve residual data from all earthquakes within the Atlantic.
First, let’s retrieve residual data from all earthquakes within the Atlantic.
Retrieves residual data from all earthquakes within the Atlantic surrounding the Mid-Atlantic Ridge:
Earthquake Spatial Distribution
Earthquake Spatial Distribution
Below are the histogram plots of various spatial data regarding Mid-Atlantic Ridge earthquakes:
Plots a histogram of the earthquakes’ distance away from the Mid-Atlantic Ridge:
Plots a histogram of focal depths of Atlantic Earthquakes:
Gutenberg-Richter Law
Gutenberg-Richter Law
In a 1944 paper by Charles Richter and Beno Gutenberg, it was discovered that all earthquakes within a specific region follow a specific linear relationship between the magnitude of an earthquake and the logarithm of the number of earthquakes with that magnitude and greater. The relationship is known as the Gutenberg-Richter Law and is given by the following equation:
Where M represents the minimum magnitude of the earthquake, N represents the number of earthquakes with magnitude M and greater within the region, and a and b are constants that are same for all values of N and M. In this next subsection, we will verify whether or not the Gutenberg-Richter Law applies for the earthquakes surrounding the Mid-Atlantic Ridge.
Plots a histogram of Mid-Atlantic Ridge earthquake magnitudes:
Retrieves (M, Log10[M]) pairs from Mid-Atlantic Ridge earthquakes:
Plots (M, Log10[M]) pairs:
Applies a linear regression to the data:
Returns an R-squared value of regression line:
Displays the regression line along with data:
As seen in the plotted data and the R-squared value, there is a exists a linear relationship between M and N, proving that Gutenberg-Richter’s Law applies for Mid-Atlantic Ridge Earthquakes. However, it appears that the latter half of the graph (i.e. magnitudes of 4.3 and greater) appear more linearly-fit than the prior half (i.e. magnitudes of 4.2 and less), which is reflected in the R-squared value of 0.9377. The reason for this could be due to the fact that the time period isn’t long enough. Nevertheless, a linear trend clearly exists, verifying that the Gutenberg-Richter Law similarly applies to earthquakes in the Mid-Atlantic Ridge.
Gaussian-like Distribution of Distance From MAR Versus Earthquake Magnitude
Gaussian-like Distribution of Distance From MAR Versus Earthquake Magnitude
After plotting single-variable data on histograms, we decided to compare variables with one another. In this section, I specifically compared Earthquake Magnitude to the Distance from the Mid-Atlantic Ridge.
Plots distance from MAR versus earthquake magnitude:
As seen from the graph above, it appears that most of the data points follow a Gaussian-like distribution, centered at a magnitude of around 4.7.
Seismic Activity Trends with respect to Various Earthquake Parameters
Seismic Activity Trends with respect to Various Earthquake Parameters
In this subsection, we explore more trends between various variables with one another.
Plots earthquake depth versus distance from MAR:
Plots earthquake depth versus earthquake magnitude:
As seen from the plots above, no noticeable trends were identified from the graphs, either due to low data-resolution or the fact that the data doesn’t conform to any specific distribution.
Monthly Spatial Distribution of Earthquakes
Monthly Spatial Distribution of Earthquakes
In this subsection, we explore trends of earthquakes over time.
Downloads monthly earthquake data in 2023:
Creates a manipulate for analyzing earthquake data over time.
Using the Manipulate above, I determined that the distribution of earthquakes in each month appears to be random; there doesn’t exist any sort of trend in earthquake distribution over time.
Conclusion and Future Directions
Conclusion and Future Directions
In conclusion, this study represents an accurate model of the Mid-Atlantic Ridge axis, as well as a comprehensive statistical analysis of seismic activity trends with respect to earthquake magnitude, depth, and spatial distribution. We hope that this research will allow us to better understand Earth’s tectonic and seismic processes, helping geologists better analyze and predict trends of the Earth in the past, present, and future. In addition, we wish that the seismic trends discovered within this study can be used to not only better understand tectonic plate movement and magma movement from underground, but also the underwater ecosystems lying near the Mid-Atlantic Ridge.
Applying methodologies within this study, we hope to create a general pipeline for mapping out underwater mountain chains, like that of the Mid-Atlantic Ridge, in order to study the entirety of the Mid-Ocean Ridge System. By gathering more earthquake data, we hope to gather more empirical evidence for the Gutenberg-Richter Law, and to discover broader relationships between various seismic data across the entire Mid-Ocean Ridge System. Additionally, we wish to potentially apply machine learning to predicting earthquakes around the Mid-Atlantic Ridge, using latitude and longitude data as well as various underwater oceanic parameter data.
Applying methodologies within this study, we hope to create a general pipeline for mapping out underwater mountain chains, like that of the Mid-Atlantic Ridge, in order to study the entirety of the Mid-Ocean Ridge System. By gathering more earthquake data, we hope to gather more empirical evidence for the Gutenberg-Richter Law, and to discover broader relationships between various seismic data across the entire Mid-Ocean Ridge System. Additionally, we wish to potentially apply machine learning to predicting earthquakes around the Mid-Atlantic Ridge, using latitude and longitude data as well as various underwater oceanic parameter data.
Acknowledgements
Acknowledgements
◼
Karan Chakravarthy, for his amazing mentorship throughout this project
◼
Stephen Wolfram, for Wolfram Language and the wonderful Wolfram Summer Research Program
◼
The directors, TAs, and mentors for their efforts in making the Wolfram Summer Research Program possible
References
References
◼
Earle, Steven. “3.2 Magma and Magma Formation.” Opentextbc.ca, BCcampus, Sept. 2015, https://opentextbc.ca/geology/chapter/3-2-magma-and-magma-formation/
◼
“Mid-Ocean Ridges.” Noaa.gov, 2020, www.pmel.noaa.gov/eoi/nemo/explorer/concepts/mor.html
◼
“Frequency of Earthquakes in California.” Nature, vol. 156, no. 3960, Sept. 1945, pp. 371–371, www.nature.com/articles/156371a0, https://doi.org/10.1038/156371a0. Accessed 10 Apr. 2020.
◼
“What Is the Mid-Atlantic Ridge? - Universe Today.” Universe Today, 4 May 2017, www.universetoday.com/131459/mid-atlantic-ridge/.
◼
“10.4 Plates, Plate Motions, and Plate-Boundary Processes – Physical Geology.” Opentextbc.ca, Sept. 2015, https://opentextbc.ca/geology/chapter/10-4-plates-plate-motions-and-plate-boundary-processes/
◼
CITE THIS NOTEBOOK
CITE THIS NOTEBOOK
Modeling and analysis of mid-Atlantic ridge earthquakes via bathymetric and seismic data
by William Feng
Wolfram Community, STAFF PICKS, July 12, 2024
https://community.wolfram.com/groups/-/m/t/3216633
by William Feng
Wolfram Community, STAFF PICKS, July 12, 2024
https://community.wolfram.com/groups/-/m/t/3216633