Geological periods have a number of different properties, but for the purpose of exploring this domain using trees, only two properties are relevant. The data is hierarchical with a given geological period having one parent division and several subdivisions. The hierarchical nature of the data lends itself to visualization using trees.
In[]:=
Out[]=
,,,,,,
As shown above, the primary properties of use for constructing trees with these entities is the “ParentDivision” and “Subdivisions” properties. These properties allow you to “walk” the tree via nested calls on the entities.
Structure
Structure
Geological time divisions have a hierarchical structure, with eons being made up of eras being made up of periods and continuing down to epochs, and ages. Similarly, the corresponding stratigraphic layers in the rock record are made up of eonothems which are composed of erathems which are made up of systems which are made up of series and down to stages. It all comes down to what you are referring to, the time span or the geological layers laid down during the corresponding time span.
Out[]=
Geochronologic Unit | Chronostratigraphic Unit |
eon | eonothem |
era | erathem |
period | system |
epoch | series |
age | stage |
There is also the subtlety that some geochronologic units contain words like Early or Late (e.g. Early/Late Jurassic Epoch) and in those cases, the corresponding chronostratigraphic unit uses Lower and Upper, respectively. This subtlety will be ignored in the examples that follow.
This hierarchy makes it relatively easy to explore the structure of these relationships using trees. Here are a few utility functions that will be used throughout the remainder of this notebook.
In[]:=
entityChildren[property_][entity_]:=Replace[EntityValue[entity,property],_Missing->None]
In[]:=
Options[EntityPropertyTree]=Options[NestTree];
In[]:=
EntityPropertyTree[entity_,property_,n_:1,opts:OptionsPattern[EntityPropertyTree]]:=NestTree[entityChildren[property],entity,n,opts]
Basic Trees
Basic Trees
One basic tree that can be constructed is made by walking down from the broadest time entity in the hierarchy down to the entity itself and then to its subdivisions. The styling is obtained using support for new options in version 13.1 of the Wolfram Language.
In[]:=
simpleParentTree[tree:Tree[period_,_]]:=Tree[period["ParentDivision"],{tree}]
In[]:=
simpleStyleOptions={TreeElementLabelFunction->All->(Text[#["Name"]]&)};
In[]:=
SimpleGeologicalPeriodTree[period_Entity,n_:1]:=Tree[NestWhile[simpleParentTree,EntityPropertyTree[period,"Subdivisions",n],Not@*MissingQ@*TreeData,1,Infinity,-2],simpleStyleOptions]
This constructs a simple ancestor/descendant tree for the Jurassic Period. This shows some structure if the entity has multiple descendants.
In[]:=
SimpleGeologicalPeriodTree
Out[]=
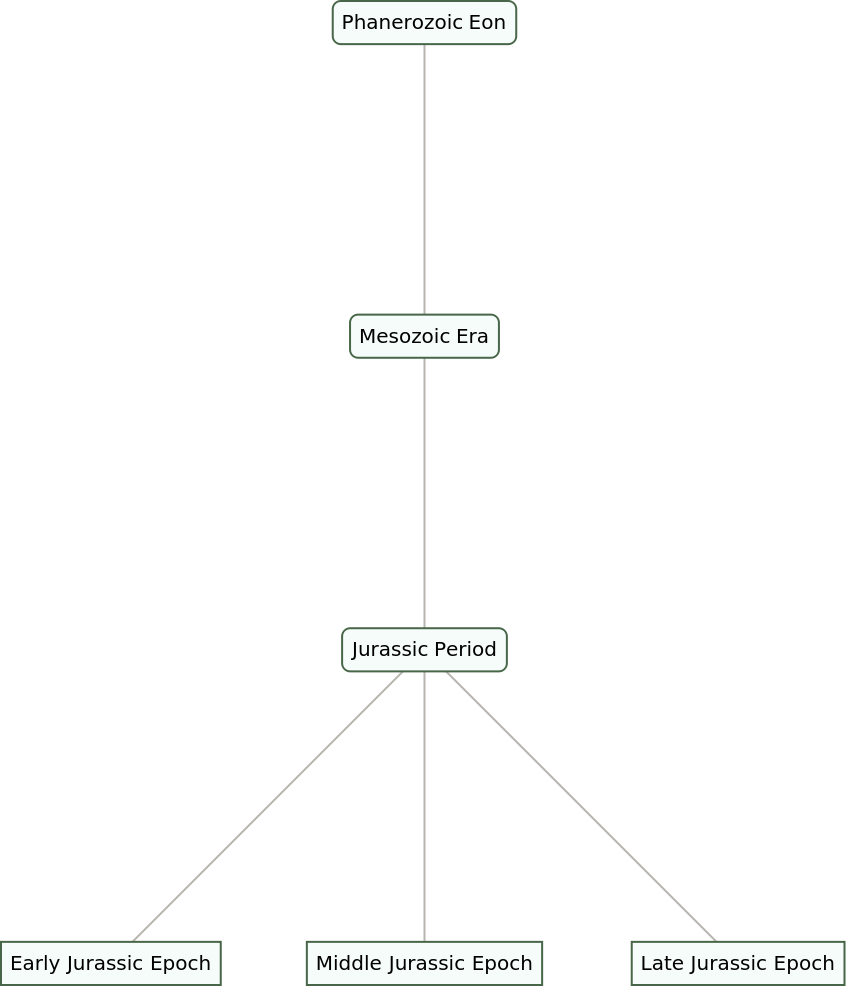
If you try to construct such a tree going all the way to a “bottom leaf”, then there are no further subdivisions and the tree is rather boring, just a straight trunk.
In[]:=
SimpleGeologicalPeriodTree
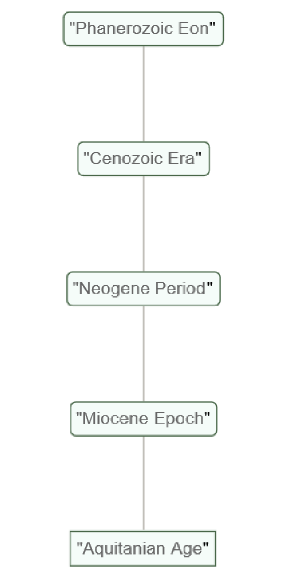
Although these trees are functional, they are pretty minimal. It might be interesting to include more “context” by including the subdivisions of other entities along the main trunk.
Additional Structure and Style
Additional Structure and Style
This version includes more structure and even includes the official map color for each time period, as defined by the Commission for the Global Map of the World.
In[]:=
fancyParentTree[tree:Tree[period_,_]]:=With[{parent=period["ParentDivision"]},Tree[parent,entityChildren["Subdivisions"][parent]/.period->tree]]
The style options are adjusted to provide color and to strip off the time granularity from the entity names. So things like “Cambrian Period” become just “Cambrian”. This serves a double purpose of making the displayed names shorter and also allowing the results to refer both to stratigraphic layers (e.g. Cambrian System) as well as the corresponding time unit (Cambrian Period). Though the input entities still refer to the time unit.
In[]:=
styleOptions={TreeElementStyleFunction->All->(#["CGMWColor"]&),TreeElementLabelFunction->All->(Text[StringReplace[#["Name"],{" Supereon"|" Eon"|" Era"|" Period"|" Epoch"|" Age"->""}]]&)};
In[]:=
FancyGeologicalPeriodTree[period_Entity,n_:1]:=Tree[NestWhile[fancyParentTree,EntityPropertyTree[period,"Subdivisions",n],TreeQ,1,Infinity,-3],styleOptions]
As shown in the following example, this shows all of the direct ancestors for the specified entity, as well as siblings of the requested entity and siblings of all direct ancestors along the primary trunk. The tree never goes further than on level down from the requested entity so only shows immediate descendants if there are any. Here’s an example focused on an entity that is a “leaf” node with no descendants. The entity in question is at the very bottom of the tree because it has no descendants.
In[]:=
FancyGeologicalPeriodTree
Out[]=
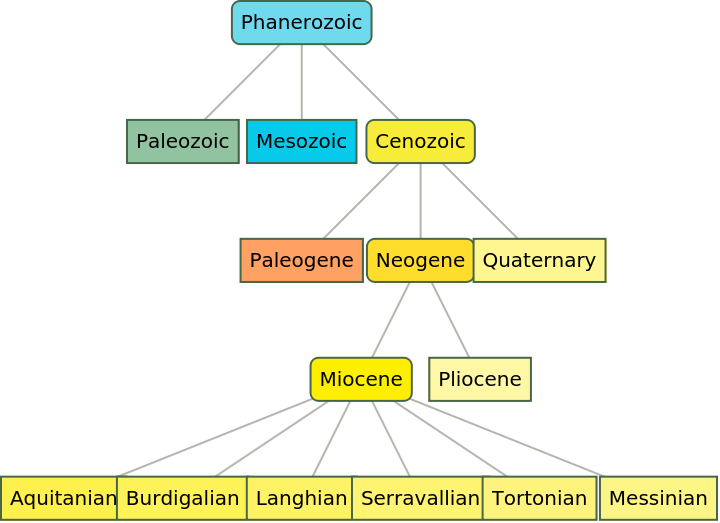
A nearly identical tree results if the entity in question is one level up from the bottom. Epochs/series have ages/stages as their descendants.
In[]:=
FancyGeologicalPeriodTree
Out[]=
Some smaller examples:
In[]:=
FancyGeologicalPeriodTree
Out[]=
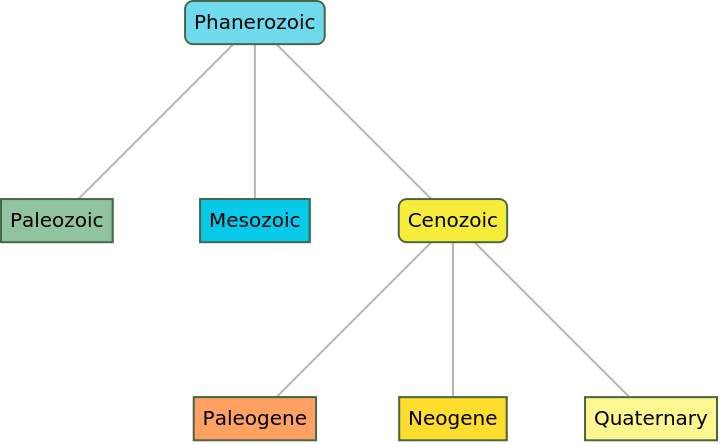
An interestingly symmetric example:
Restricting Depth
Restricting Depth
This form starts at the specified entity and goes down from there, so is only a descendant structure (no ancestors) and allows you to specify how many levels to go down. This implementation may suffer from very wide outputs and overlapping labels with default option settings.
The official colors for periods and their descendants have similar colors:
Traversing to lower levels introduces more varied colors, but can result in label/node collisions:
As shown above, the default tree layout is suboptimal for large numbers of nodes since the necessary width to avoid label overlap is problematic. Changing the default TreeLayout helps. The Phanerozoic Eon is explored here going down only 3 levels below the parent, encompassing eras, periods, and epochs.
Extending the tree down an additional level to include ages once again runs into “crowding” issues. Periods, epochs, and ages all overlap each other.
A different layout:
A horizontal layout is readable, but has a very tall result so requires scrolling down to see everything.
This structure is nearly optimal, but has lots of white space causing the visual size of the result to be sub-optimal. Up to this point all of these explorations have been purely structural. What if we could remove the white space, but maintain the basic layout while also providing additional information allowing the data to be quantified and not purely structural?
Quantifying the Structure
Quantifying the Structure
A common way to visualize geological time periods is to view them in a chart similar to what’s known as a flame chart, due to the data being hierarchical with longer time periods subdivided into shorter time periods at multiple levels. In these charts, time usually runs vertically, with the hierarchical subdivisions running horizontally.
The result is still a tree, but with the edges not shown so that the nodes run up against each other. Also, a time axis provides additional context. Nodes are drawn with a rectangle whose height corresponds directly to the length of each time period.
The Precambrian is a long time period early in the Earth’s geologic history that encapsulates all of the oldest eons/eonothems and their descendants.
In contrast to the oldest time spans, we can also explore the most recent geological period/system, the Quaternary:
The Cambrian is interesting because some of its subdivisions have not yet been officially recognized so there are gaps in the available data.
The Phanerozoic spans all of the time since the Precambrian, which contains 3 eons/eonothems itself (Hadean, Archean, Proterozoic).
The Paleozoic starts with the Cambrian and ends with the Permian.