Earth Day is April 22, and it’s almost here. To mark the day, I want to share the new Food Carbon Footprint dataset available in the Wolfram Data Repository. The dataset contains greenhouse gas (GHG) emissions data from the production and processing of more than 500 foods.
What’s the problem with greenhouse gases?
What’s the problem with greenhouse gases?
The carbon footprint from food production and processing is the total amount of greenhouse gases produced from growing crops, raising animals, transporting those crops and animals, and manufacturing the resulting food products. What’s the problem with greenhouse gases? They trap heat in the atmosphere.
To capture all GHG emissions, researchers express the results as carbon dioxide equivalents (CO₂e). In addition to carbon dioxide (CO₂), greenhouse gases included in CO₂e results are methane, nitrous oxide, hydrofluorocarbons, perfluorocarbons, sulphur hexafluoride and nitrogen trifluoride. CO₂e are calculated by multiplying the amount of a greenhouse gas by its global warming potential (GWP) relative to CO₂. GWP is a measure of how much heat a greenhouse gas traps in the atmosphere over a specific time period, usually 100 years, compared to CO₂.
To capture all GHG emissions, researchers express the results as carbon dioxide equivalents (CO₂e). In addition to carbon dioxide (CO₂), greenhouse gases included in CO₂e results are methane, nitrous oxide, hydrofluorocarbons, perfluorocarbons, sulphur hexafluoride and nitrogen trifluoride. CO₂e are calculated by multiplying the amount of a greenhouse gas by its global warming potential (GWP) relative to CO₂. GWP is a measure of how much heat a greenhouse gas traps in the atmosphere over a specific time period, usually 100 years, compared to CO₂.
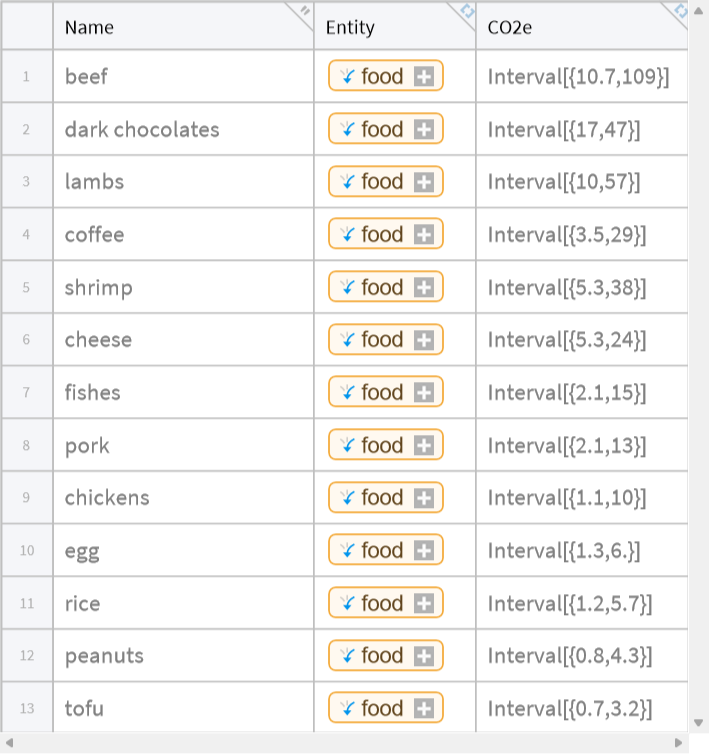
Each row in the Food Carbon Footprint dataset has three columns: food common name, food entity in Wolfram Language, and CO₂e per kilogram of that food. The data has been compiled from multiple reliable sources, which is why an interval range of CO₂e is given for each food, rather than a single value.
In[]:=
data=ResourceData["Food Carbon Footprint"]
Out[]=
transformedData=DeleteColumns[TransformColumns[data,"CO2e"->(N@Mean@First[#CO2e]&)],"Entity"];sortedData=SortBy[transformedData,"CO2e"];
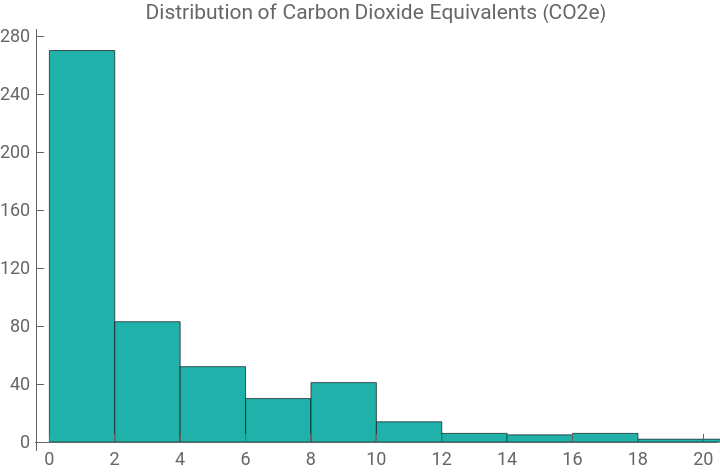
Looking at the overall distribution of the data (excluding the highest outliers), a histogram reveals that a large number of foods have an average CO₂e value of less than 2:
In[]:=
HistogramsortedData->"CO2e",
Out[]=
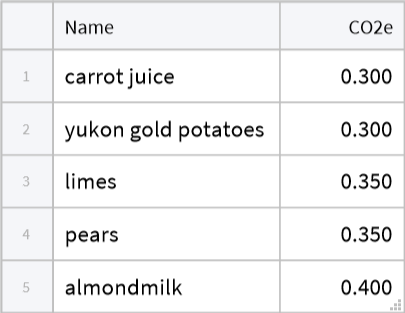
Get the foods with the lowest carbon footprint:
In[]:=
TakeSmallestBy[sortedData,#CO2e&,5]
Out[]=
Get the foods with the highest carbon footprint:
In[]:=
TakeLargestBy[sortedData,#CO2e&,5]
Out[]=
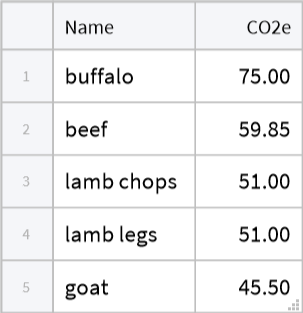
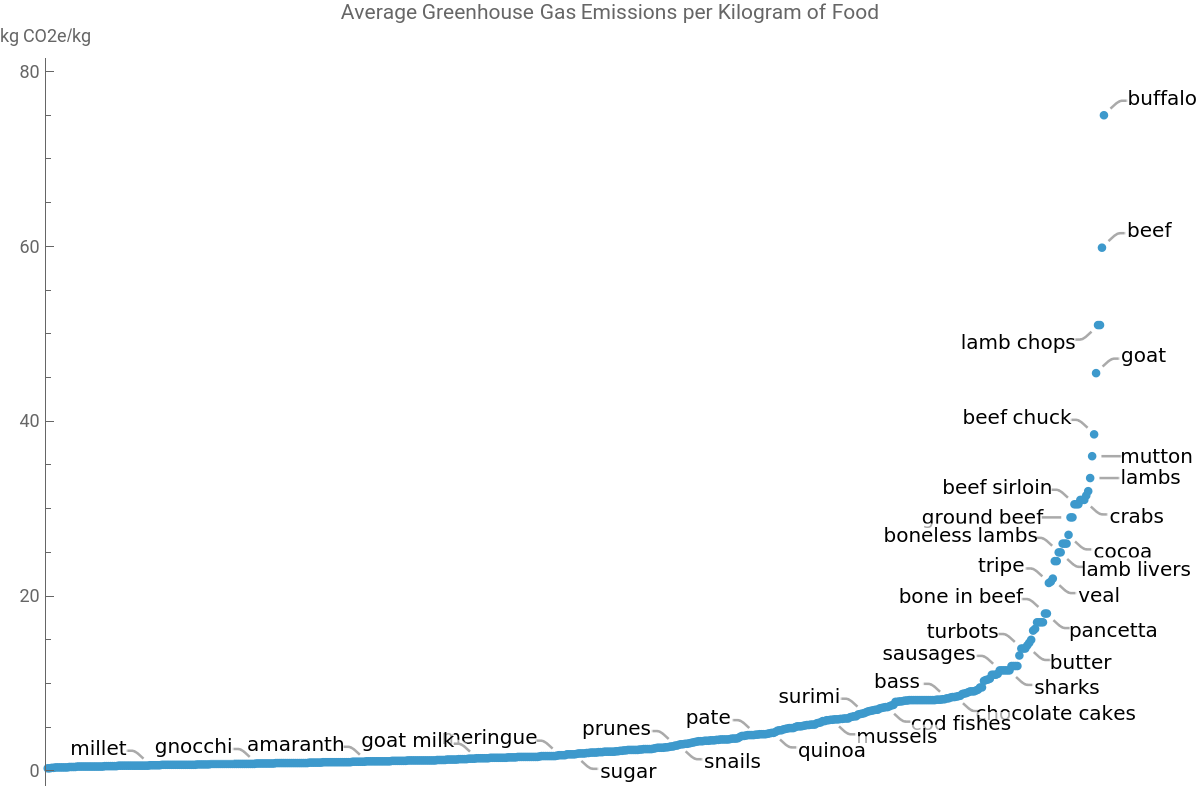
It’s evident that meats tend to have high carbon footprints, while plant-based foods generally have a lower footprint.
Plot the average GHG emissions for all foods in the data:
In[]:=
ListPlotsortedData->"CO2e",
Out[]=
Cooking and baking
Cooking and baking
Besides GHG emissions from food production, cooking and baking also leave a carbon footprint. Using formulas available in Wolfram|Alpha, you can get answers to questions about the carbon footprint of cooking with electricity versus gas: Energy use and carbon footprint in cooking and cold storage
Reducing food waste
Reducing food waste
Decomposition of organic matter in landfills produces methane, a potent greenhouse gas. “Buying loose” can help reduce the food waste in these landfills. If you need only two carrots and three potatoes for a stew, you can buy them individually—not whole bags that you may toss out eventually. The produce you eat will be fresher, and you save money too.
If you have fresh ingredients you need to use soon, ask the LLM to create a custom recipe so they don’t go to waste:
If you have fresh ingredients you need to use soon, ask the LLM to create a custom recipe so they don’t go to waste:
In[]:=
LLMSynthesize["I have carrots, potatoes, salmon, lemons and parsley that will go bad soon if I don't use them. I hate to waste food. Please give me a tasty recipe to use them."]
Out[]=
You can make a delicious **Lemon Herb Salmon with Roasted Carrots and Potatoes**! Here’s a simple recipe that incorporates all the ingredients you have:### Ingredients:- 2 salmon fillets- 2-3 carrots, peeled and cut into sticks or rounds- 2-3 potatoes, diced into cubes- 1 lemon (zested and juiced)- Fresh parsley, chopped (reserve some for garnish)- Olive oil- Salt and pepper- Optional: garlic powder or minced garlic, and any other herbs you enjoy (like thyme or rosemary)### Instructions:1. **Preheat the oven** to 400°F (200°C).2. **Prepare the vegetables**: In a large bowl, combine the diced potatoes and carrots. Drizzle with olive oil, and season with salt, pepper, and any additional herbs or garlic if desired. Toss until well coated.3. **Roast the vegetables**: Spread the potatoes and carrots out on a baking sheet in a single layer. Roast in the oven for about 20 minutes.4. **Prepare the salmon**: While the vegetables are roasting, season the salmon fillets with salt, pepper, lemon zest, and half of the lemon juice. You can also drizzle a bit of olive oil over them for added flavor.5. **Add the salmon**: After the vegetables have been roasting for 20 minutes, remove the baking sheet from the oven and push the veggies to the sides to make space for the salmon fillets. Place the salmon in the center of the baking sheet.6. **Return to the oven**: Put the baking sheet back in the oven and roast everything for an additional 12-15 minutes, or until the salmon is cooked through and flakes easily with a fork, and the potatoes are tender.7. **Garnish and serve**: Remove from the oven and squeeze the remaining lemon juice over everything. Sprinkle the fresh chopped parsley on top for a pop of color and flavor.Enjoy your delicious Lemon Herb Salmon with Roasted Carrots and Potatoes! This meal is not only tasty but also a great way to use up your ingredients.
For more recipes and useful tips: Love Food Hate Waste
Composition of greenhouse gas emissions
Composition of greenhouse gas emissions
Carbon dioxide accounts for more than three-fourths of total greenhouse gas emissions globally, primarily through burning fossil fuels and solid waste. These emissions are compounded by the deforestation that leads to higher CO₂ levels in the atmosphere. Methane is emitted during production and transport of oil, natural gas and coal, in addition to methane emissions from livestock. Nitrous oxide is emitted during a variety of agricultural and industrial practices.
Fluorinated gases—hydrofluorocarbons (HFCs), perfluorocarbons (PFCs), sulfur hexafluoride (SF6), and nitrogen trifluoride (NF3), do not occur naturally. A few sources of fluorinated gases are refrigerants, aerosol propellants and semiconductor manufacturing. They are the most potent greenhouse gases caused by human activities. Although they are emitted in smaller quantities than other greenhouse gases, for a given amount of mass, they trap substantially more heat than carbon dioxide. Some fluorinated gases have atmospheric lifetimes of thousands of years.
All of the long-lived greenhouse gases remain in the atmosphere for enough time to become well mixed, meaning the amount measured in the atmosphere is roughly the same all over the world.
Historical climate data in Wolfram|Alpha
Historical climate data in Wolfram|Alpha
Valuable historical data is available in Wolfram|Alpha of carbon dioxide and methane concentrations globally. This data has been collected with instruments, ice cores and deep sea cores: Wolfram|Alpha global greenhouse concentrations
Global carbon dioxide concentrations over the past 100 years:
Global carbon dioxide concentrations over the past 500 years:
Global methane concentrations over the past 500 years:
Molecular structure of greenhouse gases
Molecular structure of greenhouse gases
Visualize the structure of greenhouse gases through 2D and 3D molecule plots. Rotate the 3D plots to examine the molecules from different perspectives:
Food carbon footprint data sources
Food carbon footprint data sources
"Reducing food's environmental impacts through producers and consumers (2018)," J. Poore, School of Geography and the Environment, University of Oxford; T. Nemecek, Agroscope, Agroecology and Environment Research Division, LCA Research Group, Zürich, Switzerland
CITE THIS NOTEBOOK
CITE THIS NOTEBOOK
Food carbon footprint from farm to table
by Gay Wilson
Wolfram Community, STAFF PICKS, April 18, 2025
https://community.wolfram.com/groups/-/m/t/3446787
by Gay Wilson
Wolfram Community, STAFF PICKS, April 18, 2025
https://community.wolfram.com/groups/-/m/t/3446787